Volume Indicators
VWAP (Volume Weighted Average Price)
Introduction: It is a moving average of stock’s price with added weight of volume so that traders can identify if the current price is overpriced or underpriced according to the current volume.
Terminologies:
- Volume: It is total number of shares traded over a particular period.
Explanation: VWAP is generally used to determine if the current price is overpriced or underpriced according to it’s volume before placing a order, these are specially used for buy orders where traders buy when stock’s current price is below VWAP.
How to Use:
- Buy when Stock’s price is below VWAP.
- Sell when Stock’s price is above VWAP.
VWAP Formula:
VWAP = (Sum of (Price × Volume)) / (Total Volume)
.png)
On-Balance Volume (OBV)
Introduction: The OBV ( On-Balance Volume) uses volume to determine the momentum of stock’s price. It adds the volume if the stock’s price rises and subtracts the volume if it falls.
Explanation: OBV depends on the fact that big price changes comes after big volume, weather for uptrend or downtrend. So using this fact OBV modulates the volume by adding or subtracting the price change over a period of time, which indicates the momentum of the stock.
How to Use:
- Buy when OBV is rising and stock price is stable or just started rising.
- Sell when OBV is falling and stock price is stable or just started falling.
OBV Formula:
- The OBV is calculated as follows:
OBV = Previous OBV + Volume (if Close > Previous Close)
OBV = Previous OBV - Volume (if Close < Previous Close)
OBV remains unchanged (if Close = Previous Close)
.png)
Relative Volume Percentage
Introduction: Relative volume indicates how is the current volume as compared to past average for a specific period. This helps traders to identify any abnormal volumes which may bring abnormal price changes as well.
Explanation: If the relative volume is greater than 100% then it indicates stock is traded more than previous average and there is chance of price breakout in any of the direction.
How to Use:
- Buy when stock’s price is rising and Relative Volume Percentage is more than 100%.
- Sell when stock’s price is falling and Relative Volume Percentage is more than 100%.
RVL% Formula:
- Relative Volume Percentage:
RVOL% = (Current Volume / Average Volume) × 100
Average Volume
Introduction: Average volume is simple average of stock’s volume for a specific time period like 30 days or 60 days. It assist traders to identify liquidity of the stock.
Terminologies:
- Liquidity: How easily a share can be traded in the stock market.
Explanation: Average volume helps trader to identify the stock’s liquidity, if the stock has high average volume then it indicates lots of people are buying and selling this stock and it would be easy to buy or sell this stock in the future.
How to Use:
- Stock with high average volume can be traded normally according to investor’s strategy, but stock with very low average volume should be traded with caution as if you buy a low average volume stock, it would be very hard to sell the stock at a good price because of very low demand.
Formula for Average Volume:
- Average Volume: The average number of shares traded per day, calculated using:
- Where:
- Total Volume Over N Days: The sum of daily volumes over a specified number of days.
- N: The total number of days considered.
Average Volume = (Total Volume Over N Days) / N
Chaikin Money Flow (CMF)
Introduction: : CMF ( Chaikin Money Flow ) indicates momentum of the stock using stock’s price change and volume of a specific time period.
Explanation: CMF oscillates between -1 and +1 where a positive value indicates uptrend while negative value indicates downtrend.
How to Use:
- Buy when CMF moves above zero.
- Sell when CMF moves below zero.
CMF Formula:
- CMF: Chaikin Money Flow is calculated using the following formula:
- Where:
- Accumulation/Distribution Line (ADL): The Accumulation/Distribution line is a cumulative total of the Money Flow Multiplier multiplied by the volume for each period.
- Money Flow Multiplier: Calculated as:
Money Flow Multiplier = ((Close - Low) - (High - Close)) / (High - Low) - Volume: The trading volume for the period.
- N: The number of periods over which the CMF is calculated, typically 20 periods.
CMF = (Accumulation/Distribution Line) / N
Money Flow Index (MFI)
Introduction: Money flow indicates if the stock is overbought or underbought using both price and volume to calculate strength of momentum of a stock.
Explanation: MVI oscillates between 0 to 100. A value more than 80 indicates overbought condition where as value less than 20 indicates underbought condition.
How to Use:
- Buy when Money Flow Index (MFI) is rising and less than 25.
- Sell when Money Flow Index (MFI) is falling and more than 75.
MFI Formula:
- MFI: The Money Flow Index is calculated using the following formula:
- Where:
- Money Flow Ratio: The ratio of positive money flow to negative money flow.
- Positive Money Flow: The sum of the typical price multiplied by volume for all periods where the typical price is greater than the previous period's typical price.
- Negative Money Flow: The sum of the typical price multiplied by volume for all periods where the typical price is less than the previous period's typical price.
- Typical Price: The average of the high, low, and close prices for the period:
Typical Price = (High + Low + Close) / 3
MFI = 100 - (100 / (1 + Money Flow Ratio))
.png)
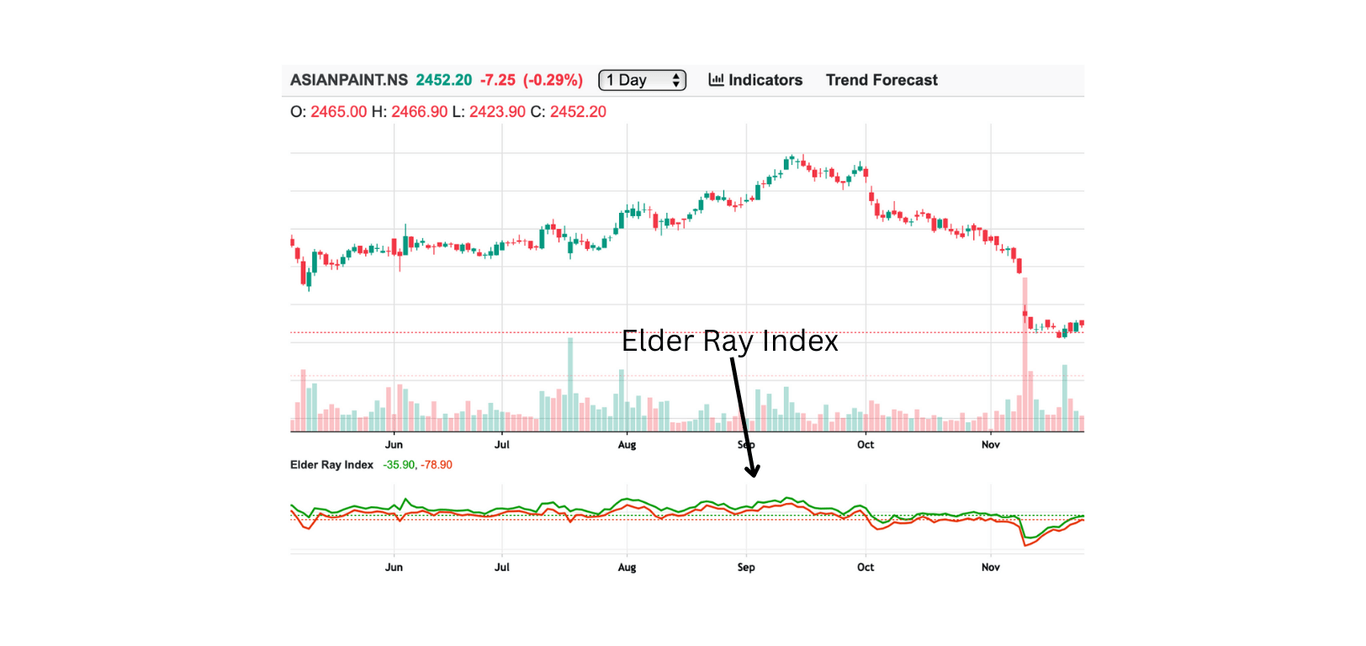
Elder Ray Index
Introduction: Elder Ray Index helps trader to confirm trend and strength of the trend by measuring the strength of buyers and sellers.
Explanation: The Elder Ray Index comprises of two lines one is called as bull power which is difference between highest price and EMA (Exponential Moving Average) and second is bear power which is difference between lowest price and EMA (Exponential Moving Average).
How to Use:
- Buy when Bull power is positive and rising.
- Sell when Bear power is negative and falling.
Elder Ray Index Formula:
- Bull Power: The Bull Power is calculated as:
- Bear Power: The Bear Power is calculated as:
Bull Power = High - Exponential Moving Average (EMA)
Bear Power = Low - Exponential Moving Average (EMA)
Vortex Indicator
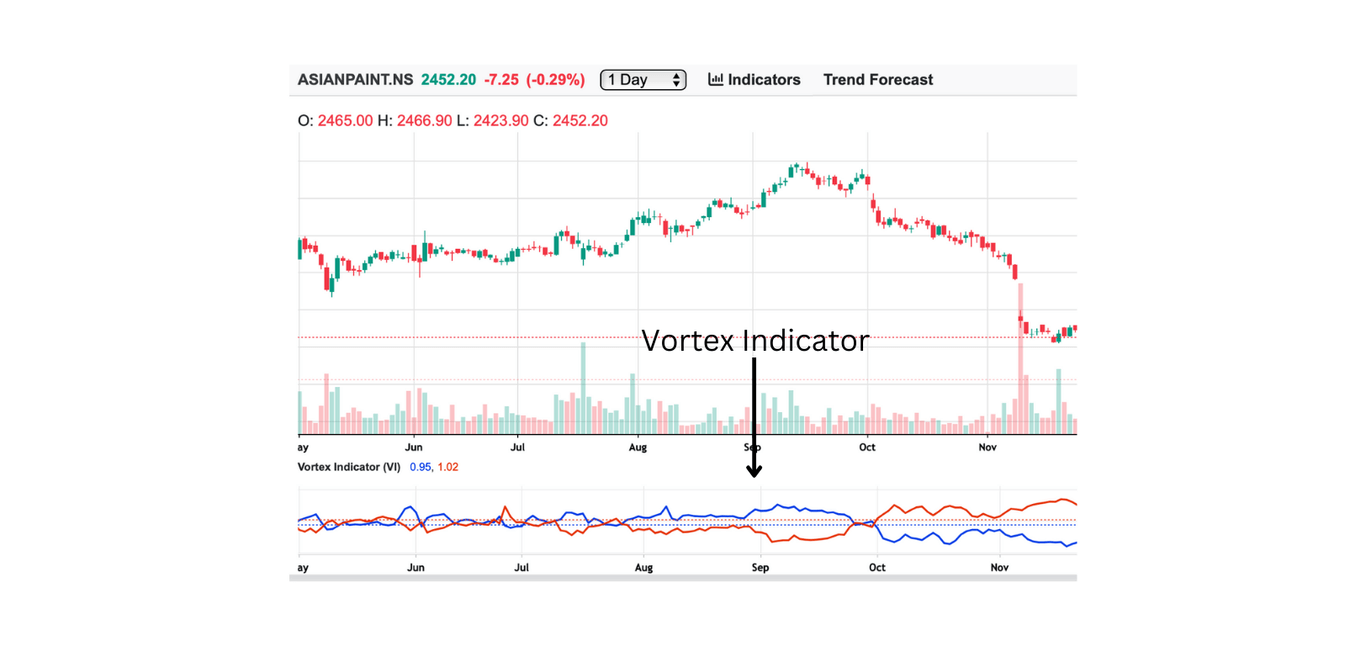
Introduction: Vortex Indicators helps to identify the possible trend reversal point as well as the direction of trend of the stock’s price.
Explanation: Vortex Indicator Comprises of two lines named as VI+ and VI- , where VI+ indicates strength of uptrend whereas VI- indicates strength of downtrend.
How to Use:
- Buy when VI+ crosses above VI-
- Sell when VI+ crosses below the VI-
VI Formula:
- VI+ (Positive Vortex): This line represents the positive trend and is calculated as follows:
- VI- (Negative Vortex): This line represents the negative trend and is calculated as follows:
- Where:
- Current High and Current Low: The high and low of the current period.
- Previous High and Previous Low: The high and low of the previous period.
- ATR (Average True Range): The average of the true ranges of the last n periods. ATR measures the volatility of the price movement.
VI+ = (Current High - Previous Low) / ATR
VI- = (Current Low - Previous High) / ATR
Klinger Volume Oscillator (KVO)
Introduction: Klinger Volume Oscillator helps traders to identify trends especially long term trends and possible trend reversal points using both volume and change in price of a stock for a particular period.
Explanation: KVO ( Klinger Volume Oscillator ) oscillates around zero where positive KVO indicates uptrend and negative KVO indicates downtrend.
How to Use:
- Buy when KVO crosses above zero, indicating uptrend.
- Sell when KVO crosses below zero, indicating downtrend.
KVO Formula:
- KVO: The Klinger Volume Oscillator is calculated using the following formula:
- Where:
- Accumulation/Distribution Line (A/D): This line is calculated by taking the sum of the money flow volume (Volume × ((Close - Low) - (High - Close)) / (High - Low)) for each period, and adding it to the previous A/D value.
- Long-Term EMA: The Exponential Moving Average (EMA) over a longer period, typically 34 periods.
- Short-Term EMA: The Exponential Moving Average (EMA) over a shorter period, typically 13 periods.
KVO = (Long-Term EMA of the Accumulation/Distribution Line) - (Short-Term EMA of the Accumulation/Distribution Line)
.png)
Chaikin Oscillator
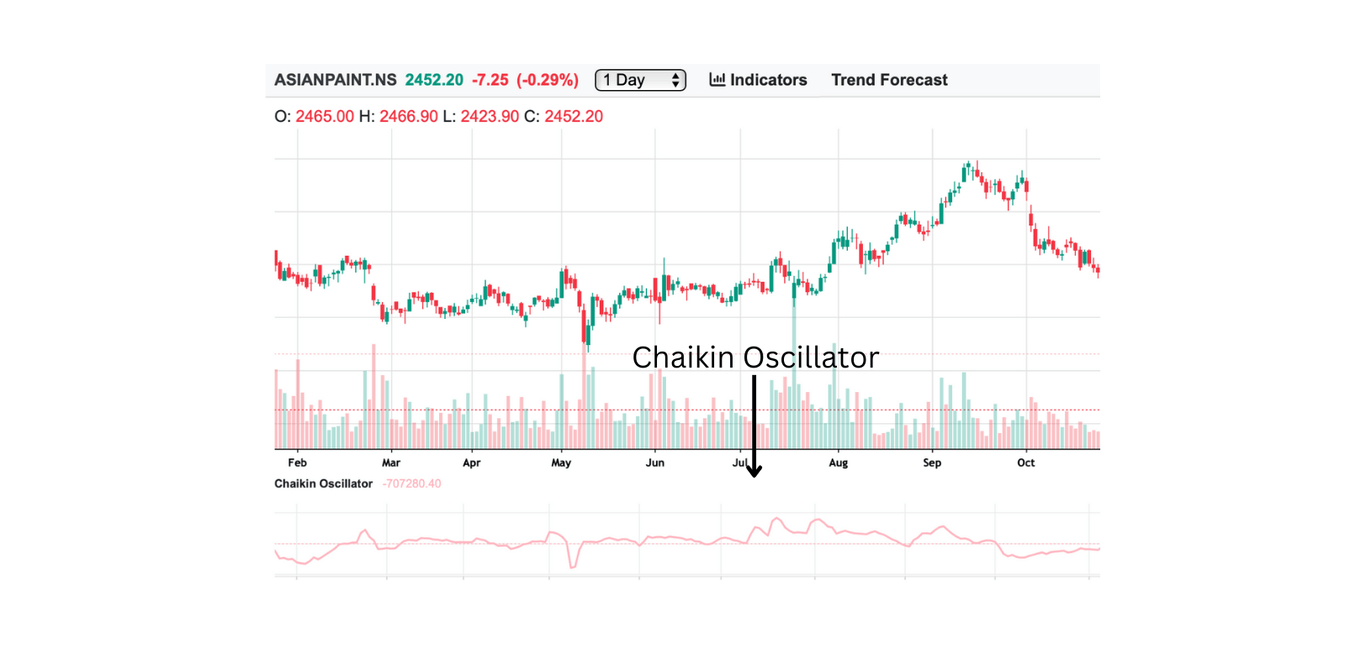
Introduction: Chaikin Oscillator helps traders to identify strength of the current trend using change in price in context of it’s volume for a particular time period.
Explanation: The Chaikin Oscillator uses difference of 3-day EMA and 10-day EMA of change in price in context of it’s volume for a particular time period, indicating trend and strength of the trend.
How to Use:
- Buy when Chaikin Oscillator crosses above zero, indicating uptrend.
- Sell when Chaikin Oscillator crosses below zero, indicating downtrend.
Chaikin Oscillator Formula:
- Chaikin Oscillator (CO): The Chaikin Oscillator is calculated using the following formula:
- Where:
- Accumulation/Distribution (A/D): The A/D line is calculated using the formula:
A/D = ((Close - Low) - (High - Close)) / (High - Low) * Volume - EMA (Exponential Moving Average): EMA is a weighted moving average where recent prices have more weight than older prices.
Chaikin Oscillator = EMA(3) of A/D - EMA(10) of A/D
Twiggs Money Flow (TMF)
Introduction: Twiggs Money Flow (TMF) helps traders to identify strength and direction of the current trend using high, low, and close value of stock including volume as well.
Explanation: TMF helps traders to identify weather money is moving in or moving out of the stock over a predefined period to determine strength and direction of the current trend.
How to Use:
- Buy when TMF is above zero.
- Sell when TMF is below zero.
TMF Formula:
- TMF: The Twiggs Money Flow is calculated using the following formula:
- Where:
- Typical Price: The average of the high, low, and close prices for the period:
Typical Price = (High + Low + Close) / 3 - Volume: The trading volume for the period.
TMF = (Typical Price × Volume) / 100,000,000
.png)
Force Index
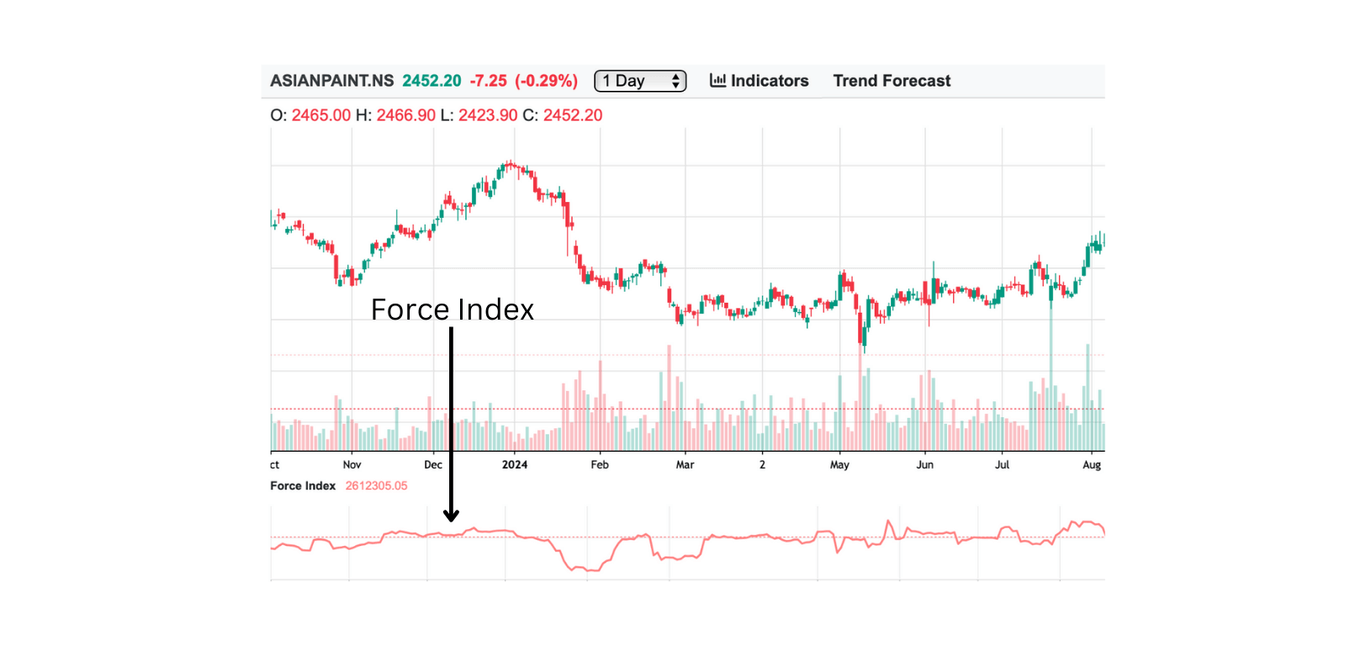
Introduction: Force Index indicates strength of a trend using moving average of change in price multiplied with its volume.
Explanation: Force Index uses change in price and volume to identify strength of the trend, where a positive value indicates uptrend and a negative value downtrend.
How to Use:
- Buy when Force Index turns positive.
- Sell when Force Index turns negative.
Force Index Formula:
- Force Index: The Force Index is calculated using the following formula:
- Where:
- Current Close: The closing price of the current period.
- Previous Close: The closing price of the previous period.
- Volume: The trading volume for the current period.
Force Index = (Current Close - Previous Close) * Volume
Qstick Indicator
Introduction: Qstick Indicators helps to identify strength of a trend and possible trend reversal points using moving average of difference of open and close value.
Explanation: A positive Qstick value represent uptrend whereas negative Qstick Value represent downtrend, Qstick indicators measures the moving average of difference in open and close value for a particular time frame.
How to Use:
- Buy when Qstick is pivoting from negative to positive.
- Sell when Qstick is pivoting from positive to negative.
Qstick Formula:
- Qstick: The Qstick is calculated using the following formula:
- Where:
- Close: The closing price for the period.
- Open: The opening price for the period.
- EMA: The Exponential Moving Average (EMA) applied to the difference between the close and open prices.
- N: The number of periods (typically 13) used for the EMA calculation.
Qstick = EMA(Close - Open, N)