Volatility Indicators
ATR (Average True Range)
Introduction: ATR ( Average True Range ) calculates volatility of the stock’s price, which means it indicates how much a stock moves on a particular time frame.
Terminologies:
- Volatility: How much a stock’s price changes for a particular time frame.
Explanation: ATR identifies the volatility of a stock’s price which helps traders to determine what are the possible range of values where the stock’s price can move for a particular timeframe.
How to Use:
- Use ATR to set the stop-loss and target both if trading under a specific time period, as on an average stock will change it’s value according to ATR.
ATR Formula:
- ATR: The Average True Range is calculated using the following formula:
- Where:
- TR (True Range): The greatest of the following three values:
- Current High - Current Low
- Absolute value of Current High - Previous Close
- Absolute value of Current Low - Previous Close
- n: The number of periods (typically 14 periods for ATR calculation).
- Previous ATR: The ATR value from the previous period.
ATR = (Previous ATR * (n-1) + TR) / n
.png)
Bollinger Bands
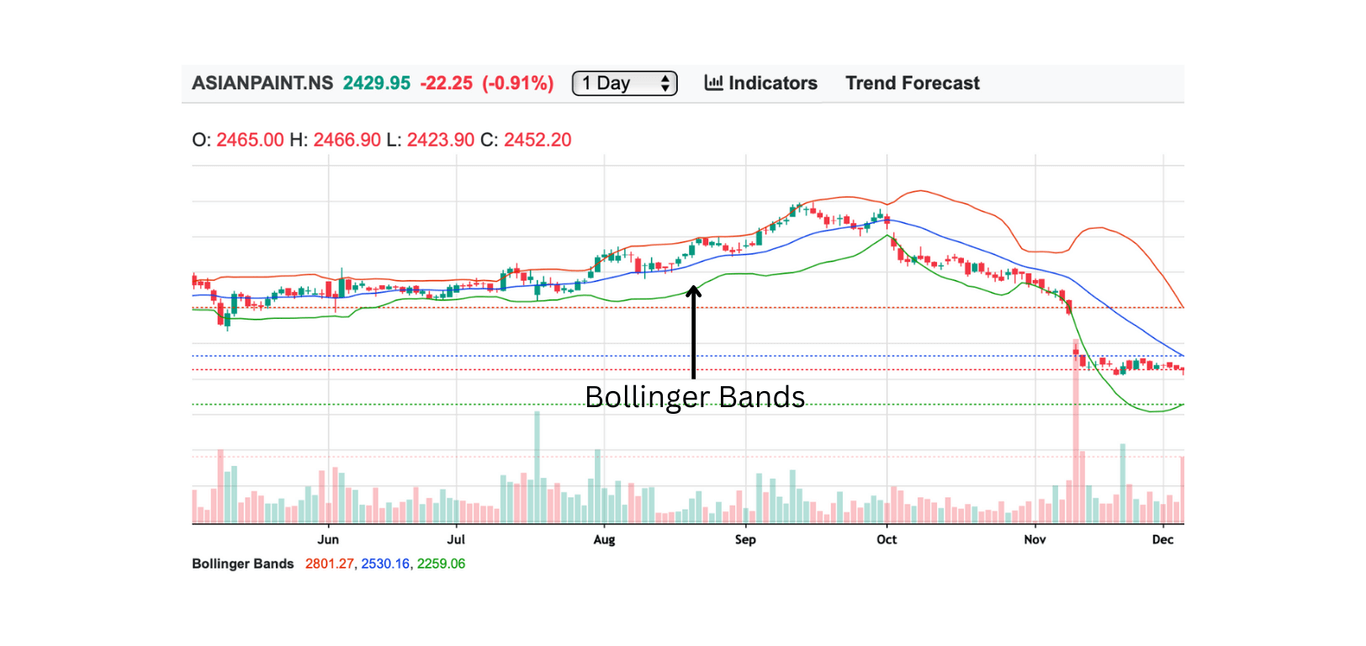
Introduction: Bollinger Bands helps trader to identify both volatility of a stock and weather the stock is overpriced or underpriced
Explanation: Bollinger bands comprises of three line, first a top line which act as resistance, second is a centre line which is a SMA and third is bottom line which act as support, traders uses this to determine weather the stock is overpriced (If closer to top line) or underpriced (if closer to bottom line ) and volatility ( difference between top and bottom line).
How to Use:
- Buy when Stock’s price is closer to bottom line and started rising.
- Sell when Stock’s price is closer to top line and started falling.
Bollinger Bands Formula:
- Middle Band: The middle band is simply the moving average (typically 20 periods) of the stock's price.
- Upper Band: The upper band is the middle band plus two times the standard deviation of the stock price over the same period.
- Lower Band: The lower band is the middle band minus two times the standard deviation of the stock price over the same period.
Middle Band = 20-period Simple Moving Average (SMA)
Upper Band = Middle Band + (2 * Standard Deviation)
Lower Band = Middle Band - (2 * Standard Deviation)
Bollinger Bandwidth
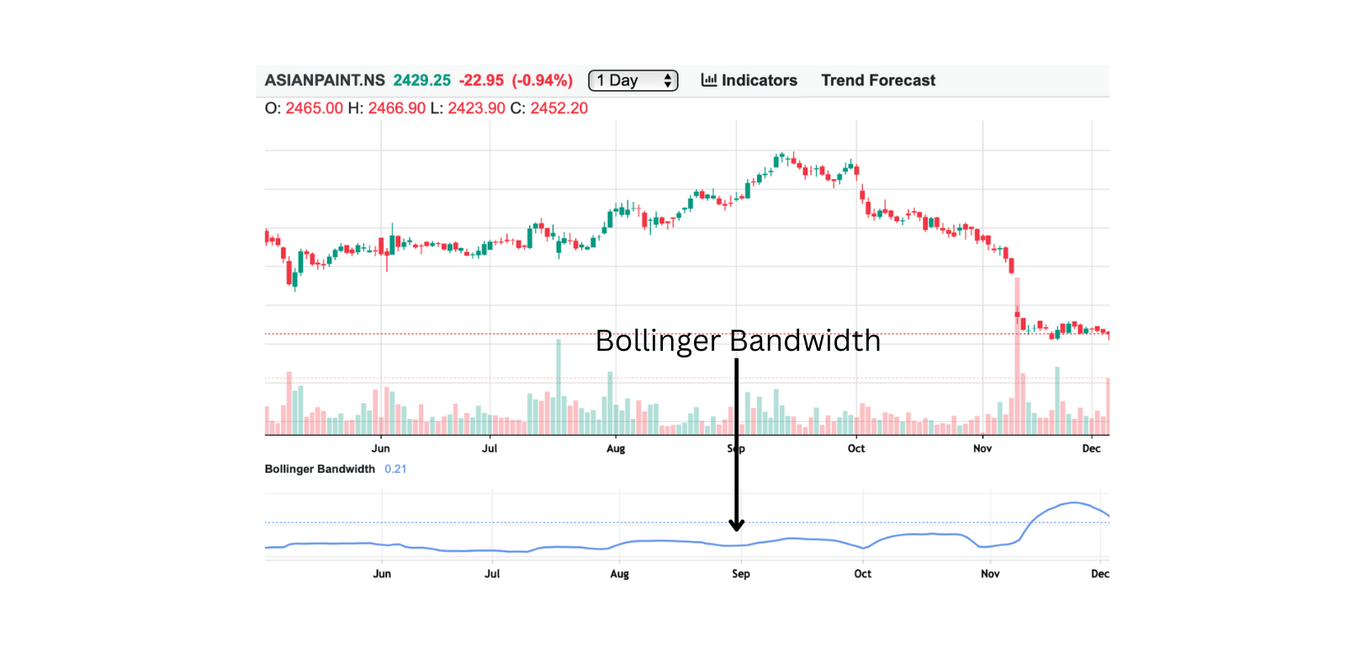
Introduction: Bollinger Bandwidth determines the volatility a stock’s price for a particular time frame.
Explanation: Bollinger Bandwidth is the difference between the top line and bottom line which simply indicates the volatility of stock’s price.
How to Use:
- Use Bollinger Bandwidth to set the stop-loss and target both if trading under a specific time period, as on an average stock will change it’s value according to Bollinger Bandwidth.
Bollinger Bandwidth Formula:
- Bollinger Bandwidth: The Bollinger Bandwidth is calculated using the following formula:
Bollinger Bandwidth = (Upper Band - Lower Band) / Moving Average
Dual Bollinger Bands
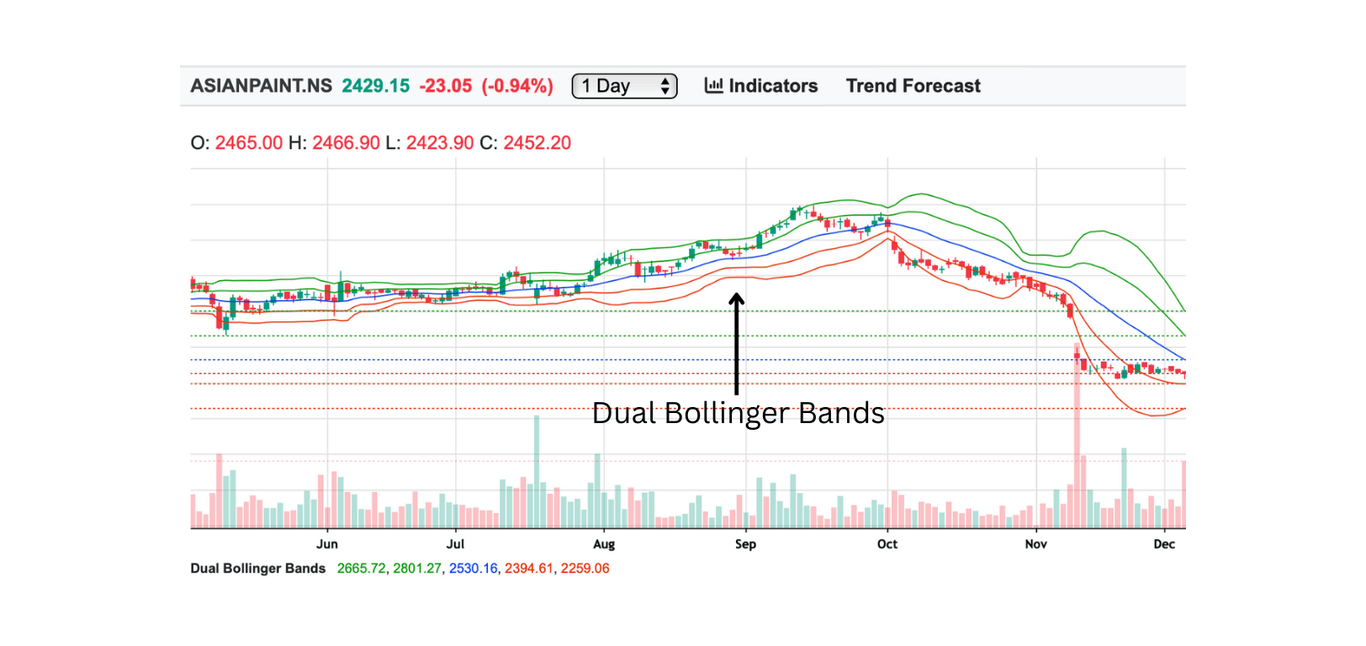
Introduction: Dual Bollinger Bands helps traders to determine short term volatility as well as long term volatility and it also gives an idea for over bought and under bought condition of stock for both long and short term.
Explanation: Dual Bollinger Bands comprises of two bollinger bands first one is measured using short term data and another one using long term data, which helps to determine multi period volatility.
How to Use:
- Buy when Stock’s price is closer to bottom most line and started rising.
- Sell when Stock’s price is closer to top most line and started falling.
Bollinger Bands Formula:
- Upper Bollinger Band: Upper Band = Moving Average + (2 * Standard Deviation)
- Lower Bollinger Band: Lower Band = Moving Average - (2 * Standard Deviation)
- Inner Upper Band: Inner Upper Band = Moving Average + (1 * Standard Deviation)
- Inner Lower Band: Inner Lower Band = Moving Average - (1 * Standard Deviation)
Keltner Channels
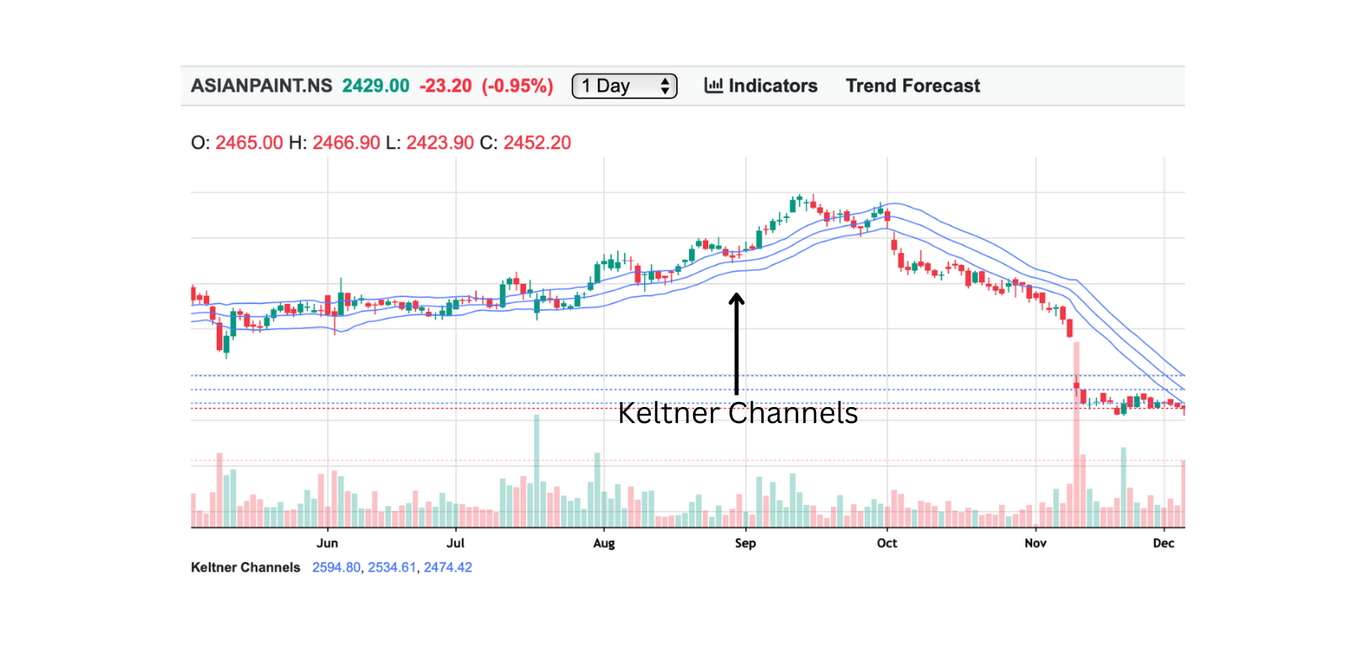
Introduction: Keltner Channels helps traders to identify volatility of the stock’s price using multiple exponential moving averages.
Explanation: Keltner channel uses three line to determine volatility one is the middle line which is EMA ( Exponential Moving Average ) and other two lines are added and subtracted with ATR (Average True Range ) and the difference between the top line and bottom line of Keltner channels the volatility of the stock.
How to Use:
- Use Keltner channel to set the stop-loss and target both if trading under a specific time period, as on an average stock will change it’s value according to Keltner channel.
Keltner Channels Formula:
- Upper Channel: Upper Channel = EMA(Typical Price) + (Multiplier * ATR)
- Middle Channel: Middle Channel = EMA(Typical Price)
- Lower Channel: Lower Channel = EMA(Typical Price) - (Multiplier * ATR)
- Where:
- Typical Price: The average of the high, low, and close prices for the period:
Typical Price = (High + Low + Close) / 3 - EMA (Exponential Moving Average): A type of moving average that gives more weight to recent prices.
- ATR (Average True Range): A measure of market volatility, typically over a 14-period range.
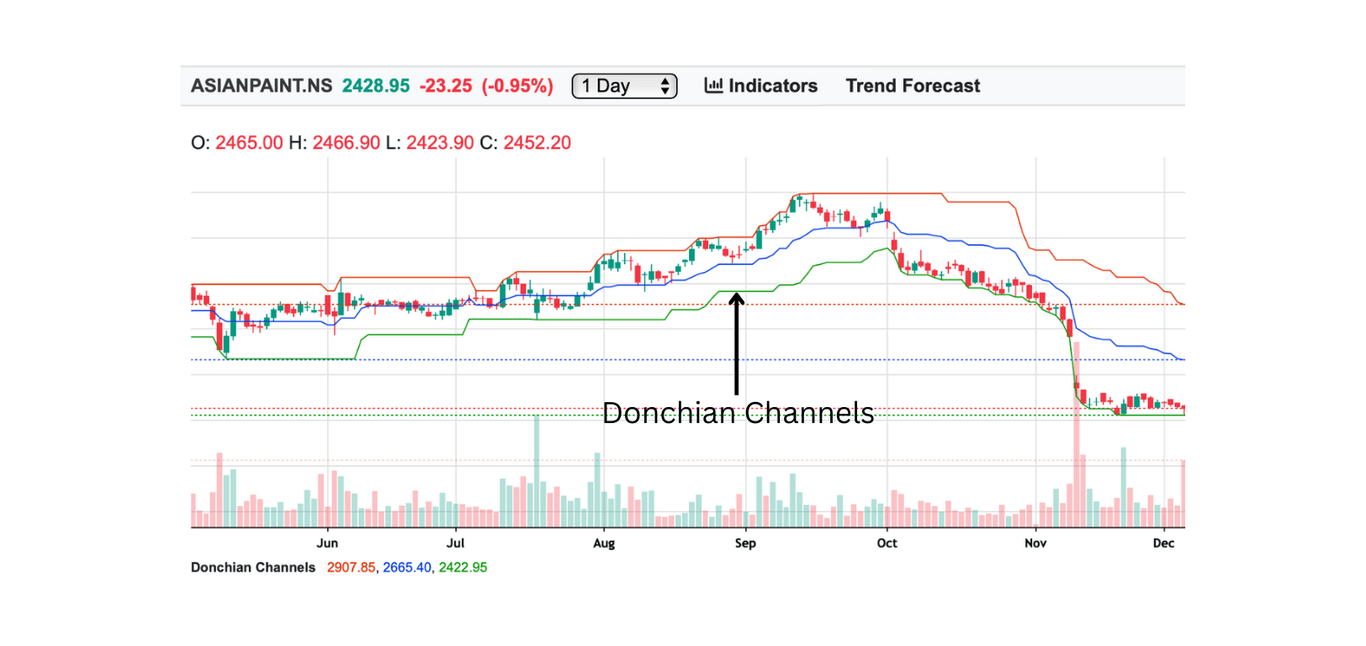
Donchian Channels
Introduction: Donchian Channels are used to determine breakout points for a particular stock by using stock’s current price and highest high and lowest low for a particular time frame.
Terminologies:
- Breakout: A point where stock stops moving between a specific levels but instead move above or below those levels and starting a new trend
Explanation: Donchian Channels looks similar to bollinger bands as it also have three lines (bands) upper band, lower band and centre line which is average of upper and lower band, Upper band is highest high and lower band is lowest low for a specific time period.
How to Use:
- Buy when Stock’s current price breaks over the upper band.
- Sell when Stock’s current price breaks below the lower band.
Donchian Channels Formula:
- Upper Band (UB): The highest high over the specified period (e.g., 20 periods).
- Lower Band (LB): The lowest low over the specified period (e.g., 20 periods).
- Middle Band (MB): The average of the upper and lower bands.
UB = Highest High over N periods
LB = Lowest Low over N periods
MB = (UB + LB) / 2
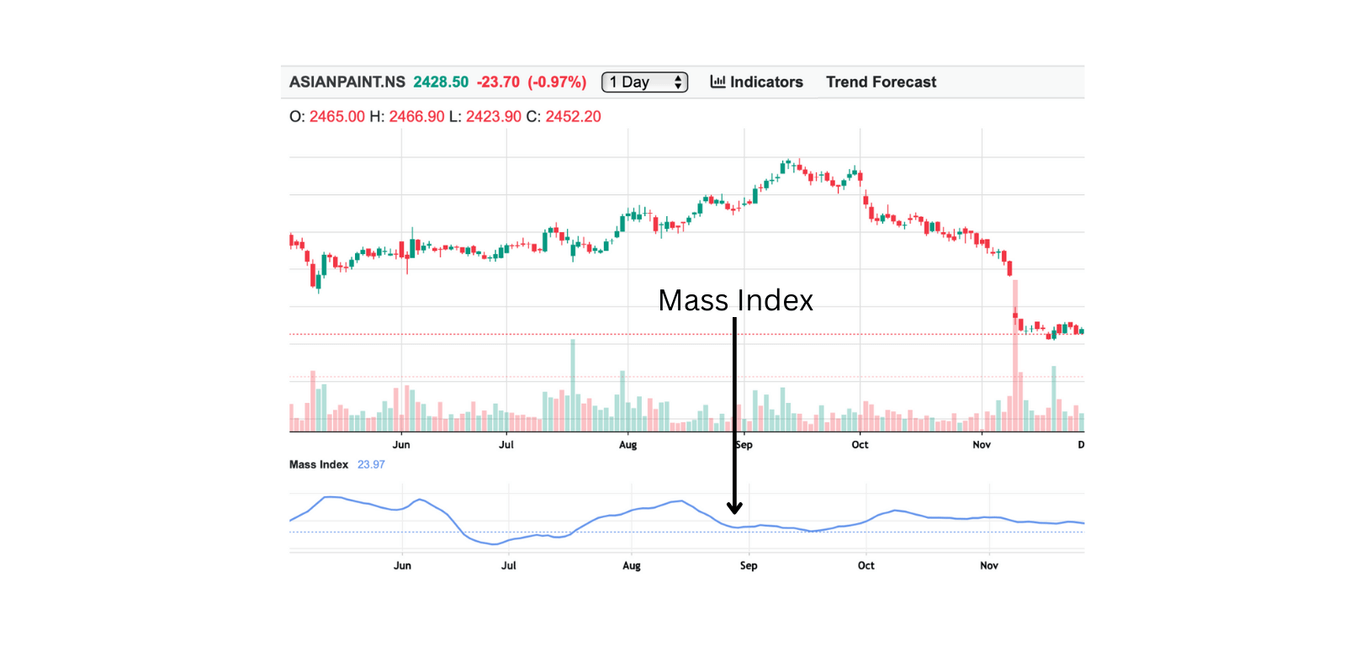
Mass Index
Introduction: Mass Index is a volatility indicators which helps to identify the potential trend reversal. Unlike other indicators id does not identify direction of trend but it determines the possible trend reversal based on price fluctuation.
Explanation: Mass Index uses price fluctuation over a set period to determine the possible trend reversal. If Mass Index for a stock is above 27 then it indicates a possible trend reversal may happen and if it is less than 26 then there is less possibility of any upcoming trend reversal.
How to Use:
- Buy when Mass Index falls from 27 to 26.
- Sell when Mass Index rises from 26 to 27.
Mass Index Formula:
- MI: The Mass Index is calculated using the following formula:
- Where:
- High: The highest price in the period.
- Low: The lowest price in the period.
- 25 periods: The Mass Index typically uses 25 periods (days) for its calculation, although it can be adjusted.
MI = Sum of (High - Low) / Sum of (High - Low) for the last 25 periods
Market Facilitation Index (MFI)
Introduction: Market Facilitation Index helps traders to determine how is the stock’s price changing according to the volume to determine strength of the trend.
Explanation: Market Facilitation Index uses change in stock’s price divided by it’s volume, which helps to determine strength of a trend, for example if Market Facilitation Index is high and volume is high as well which means high strength of current trend and in contrary if the Market Facilitation Index is low for high volume then it means there is a possible breakout scenario, it also helps to determine false break out, if Market Facilitation Index is high but low volume then it means the high change is not supported by the volume.
How to Use:
- Buy when Market Facilitation Index rises with rise in stock’s price.
- Sell when Market Facilitation Index falls with fall in stock’s price.
MFI Formula:
- MFI: The Market Facilitation Index is calculated using the following formula:
- Where:
- Close: The closing price of the stock for the period.
- Open: The opening price of the stock for the period.
- Volume: The volume of trades for the period.
MFI = (Close - Open) / Volume
.png)
TRIN (Arms Index)
Introduction: TRIN (ARMS Index) helps traders to determine both the strength of trend and overbought or underbought condition of the Market.
Explanation: TRIN (ARMS Index) uses comparison of advancing and declining stocks with advancing and declining volumes to determine strength of trend it also determines oversold and undersold condition of the market.
Example: If TRIN (ARMS Index) is below 1 then it indicates a bullish market, if the TRIN (ARMS Index) is more than 1 then it indicates a bearish market and if it’s closer to one then it indicates a neutral market.
TRIN Formula:
- TRIN: The TRIN (Arms Index) is calculated using the following formula:
- Where:
- Advancing Issues: The number of stocks that are increasing in price during the given time period.
- Declining Issues: The number of stocks that are decreasing in price during the given time period.
- Advancing Volume: The total trading volume of the advancing stocks.
- Declining Volume: The total trading volume of the declining stocks.
TRIN = (Advancing Issues / Declining Issues) / (Advancing Volume / Declining Volume)
Percent B (Bollinger Percent B)
Introduction: Percent B determines the overbought and underbought condition of a stock using current price and bollinger bands.
Explanation: Percent B simply calculates the distance between current price and lower band with respect to the width of the bollinger band, if it is 1 or more than 1 then it indicates stock is over bought, and if it is zero or less than zero than it is underbought.
How to Use:
- Buy when Percent B is equal to or less than zero.
- Sell when Percent B is greater than 1.
Percent B Formula:
- Percent B (B%): The formula for Percent B is as follows:
- Where:
- Price: The current price of the stock (usually the closing price).
- Upper Bollinger Band: The upper band, calculated as the moving average plus 2 standard deviations.
- Lower Bollinger Band: The lower band, calculated as the moving average minus 2 standard deviations.
Percent B (B%) = (Price - Lower Bollinger Band) / (Upper Bollinger Band - Lower Bollinger Band)
.png)