Trend Indicators
EMA (Exponential Moving Average)
Introduction: It is a type of moving average which gives more importance to current price as compared to other moving averages like simple moving average (SMA), and moving average is nothing but average of past prices of a stock
Terminologies:
- Weighted Average: A type of average where each data point is given different importance (Weight) at the time of taking average.
- EMAt: Exponential Moving Average at time t
- Pt: Price at time t
- n: Smoothing period
- EMAt-1: EMA from the previous time period
- Exponential: A mathematical concept in which a value grows or decreases at a very high rate
EMAt = [(Pt − EMAt-1) ÷ (n + 1)] + EMAt-1
Where:
.png)
Explanation: The EMA gives insight how the price of a particular stock is currently as compared to average of past values which is inclined to the more recent prices, so that a trader can analyse is the current price is over valued or under valued.
How to Use:
- Buy: When current price is below EMA but about to cross, indicate a possible uptrend.
- Sell: When the current price is above EMA but about to cross, indicate a possible downtrend.
Adaptive Moving Average (AMA)
Introduction: It is a kind of moving average which adjust itself according to the market conditions or market volatility, which helps it to keep up with the trendy market and avoid any false signal in sideways trend.
Terminologies:
- Volatility: It is how much a stock’s value changes over a specific period of time.
Explanation: The EMA gives insight how the price of a particular stock is currently as compared to average of past values which is inclined to the recent trend, so that a trader can analyse is the current price is over valued or under valued, and avoiding any false signals.
How to Use:
- When current price is below AMA but about to cross, indicate a possible uptrend.
- When the current price is above AMA but about to cross, indicate a possible downtrend.
The formula for AMA is:
AMAt = AMAt-1 + SC × (Pt − AMAt-1)
Where:
- AMAt: Adaptive Moving Average at time t
- AMAt-1: AMA from the previous time period
- Pt: Price at time t
- SC: Smoothing Constant, calculated as:
SC = [ER × (2 / (nfast + 1) − 2 / (nslow + 1))] + 2 / (nslow + 1) - ER: Efficiency Ratio, calculated as:
ER = |Pt − Pt−n| ÷ Σ |Pt − Pt−1|
.png)
ADX (Average Directional Index)
Introduction: It calculates the strength of a trend weather it is a uptrend or downtrend. It helps traders to identify how strong is a trend and if it may continue or not.
Terminologies:
- Trend: It indicates the direction where the price of the stock is moving, for example if a stock’s price is increasing day by day and it is moving upward then it will be termed as up-trend
- Range-bound: A scenario when the stocks price fluctuates between a particular range, for example if a stock’s price is moving between $120 and $100 then it is range bound between these two values.
Explanation: ADX (Average Directional Index) does helps trader to identify the direction of trend rather it helps to identify the strength of current trend weather it is uptrend or downtrend.
How to Use:
- Buy: If stock price is rising and ADX is more than 25 or if stock price is falling and ADX is less than 20.
- Sell: If stock price is falling and ADX is more than 25 or if stock price is falling and ADX is less than 20.
The formula for ADX is:
ADX = (|DI+ − DI−| ÷ (DI+ + DI−)) × 100
Where:
- DI+: Positive Directional Index
- DI−: Negative Directional Index
- DI+ and DI− are calculated as:
DI+ = (Smoothed +DM ÷ ATR) × 100
DI− = (Smoothed −DM ÷ ATR) × 100 - +DM: Positive Directional Movement
- −DM: Negative Directional Movement
- ATR: Average True Range
Calculation of +DM, −DM, and ATR are based on specific time period (commonly 14 days)
SAM (Simple Average Method)
Introduction: This indicator simply gives average of prices of a stock over a specific period of time (commonly 14 days).
Terminologies:
- Simple Average: Mathematical average of stock prices over a specific period of time.
Explanation: SAM (Simple Average Method) reduces the noise of volatility in stock’s price by giving average past specific period so that trader can identify overvalued or undervalued stock for a specific period.
The formula for SAM is:
SAM = (P1 + P2 + ... + Pn) ÷ n
Where:
- P1, P2, ..., Pn: Prices over a given period
- n: Number of periods (days, months, etc.)
.png)
How to Use:
- Buy: When current price is below SAM but about to cross, indicate a possible uptrend.
- Sell: When the current price is above SAM but about to cross, indicate a possible downtrend.
Incremental ADX
Introduction: Incremental ADX is nothing but rate of change of ADX to identify how quickly a trend is acquiring strength or loosing strength.
Terminologies:
- Rate of Change: It calculates the amount of change over a specific period of time.
Explanation: With ADX traders can identify strength of a trend weather uptrend or downtrend but with incremental ADX traders can identify rate of change of ADX over a time to identify if a trend is loosing strength or gaining it.
How to Use:
- Buy: If stock price is rising ,ADX is more than 25 and incremental ADX is positive or if stock price is falling, ADX is less than 20 and incremental ADX is negative.
- Sell: If stock price is falling ,ADX is more than 25 and incremental ADX is positive or if stock price is falling, ADX is less than 20 and incremental ADX is negative.
Formula:
It is difference of current ADX and the previous ADX over a specific period of time.
Parabolic SAR (Stop and Reverse)
Introduction: Parabolic SAR is an indicator which helps trader to identify trend of a stock and possible trend reversal point for the stock, to determine entry and exit points to trade the particular stock.
Terminologies:
- Stop and Reverse: A point where the current trend switches it’s direction, like from uptrend to downtrend.
Explanation: Parabolic SAR tends to follow the current trend by putting dots or line below the current price if uptrend or above if downtrend and if the parabolic SAR switches it’s position, it represents possible trend reversal.
.png)
How to Use:
- Buy: When the stock’s price is in downtrend and parabolic SAR switches its position.
- Sell: When stock’s price is in uptrend and it switches it’s position.
Ichimoku Cloud (Ichimoku Kinko Hyo)
Introduction: Ichimoku Cloud indicators gives multiple insights about a stock’s price like support and resistance level, momentum, trend direction.
Terminologies:
- Support: A price level at which stock’s price stop falling and reverses it’s trend.
- Resistance: A price level at which stock’s prices stop rising and reverses it’s trend.
- Momentum: It is a rate at which a stock’s prices are changed over a period of time.
Explanation: Ichimoku uses a cloud which helps traders to determine the trend of the stock, if the price is above the cloud then it is in uptrend and if the price of stock is below the cloud then it is in down trend and the width of cloud represent volatility of stock.
How to Use:
- Buy: When the stock’s price move above the cloud as it represents a trend reversal from downtrend to uptrend.
- Sell: When the stock’s price move below the cloud as it represents a trend reversal from uptrend to downtrend.
Formula:
- Tenkan-sen (Conversion Line):
(Highest High + Lowest Low) ÷ 2 over the last 9 periods
- Kijun-sen (Base Line):
(Highest High + Lowest Low) ÷ 2 over the last 26 periods
- Senko Span A (Leading Span A):
(Tenkan-sen + Kijun-sen) ÷ 2, plotted 26 periods ahead
- Senko Span B (Leading Span B):
(Highest High + Lowest Low) ÷ 2 over the last 52 periods, plotted 26 periods ahead
- Chikou Span (Lagging Span): Closing price, plotted 26 periods behind
.png)
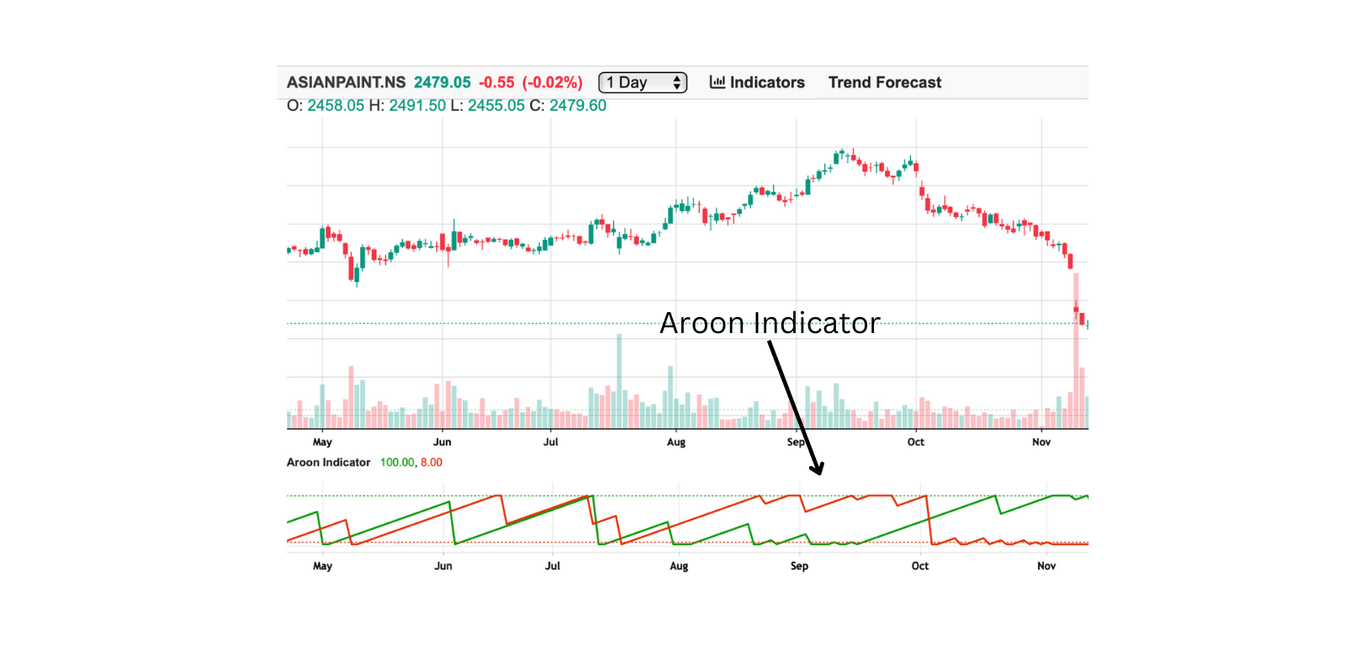
Aroon Indicator
Introduction: Aroon Indicators helps traders to identify both tend and strength of a trend for a particular stock.
Terminologies:
- Trending Market: This is the scenario where price of stock moves in a single direction either up or down.
- Range-bound Market: When the stock’s price fluctuates between a range of values.
Explanation: Aroon Indicator have two lines Aroon-up and Aroon down and both ranges between 0-100, it is nothing but measure how long was the last highest high and lowest low and traders can get insights like if current price is closer to highest high then there is good possibility the stock may fall and if current price is nearer to lowest low then there is a good possibility of trend reversal.
How to Use:
- Buy: When the Aroon up is above 70 and Arron down is below 30.
- Sell: When Aroon up is below 30 and Arron down is above 70.
Aroon Indicator Formula
To Measure both strength and trend Aroon indicator uses two lines Aroon-up and Aroon-down
- Aroon-Up: It calculates the frequency of periods after the highest high within a specific period.
- Aroon-Down: It calculates the frequency of periods after the lowest low within a specific period.
The formulas for Aroon-Up and Aroon-Down are:
Aroon-Up = ((Current Period - Highest High Period) / Period) × 100
Aroon-Down = ((Current Period - Lowest Low Period) / Period) × 100
Where:
- Period: The number of periods over which the Aroon is calculated (typically 14 days).
- Current Period: The current day being analysed.
- Highest High Period: The number of periods since the highest high in the given period.
- Lowest Low Period: The number of periods since the lowest low in the given period.
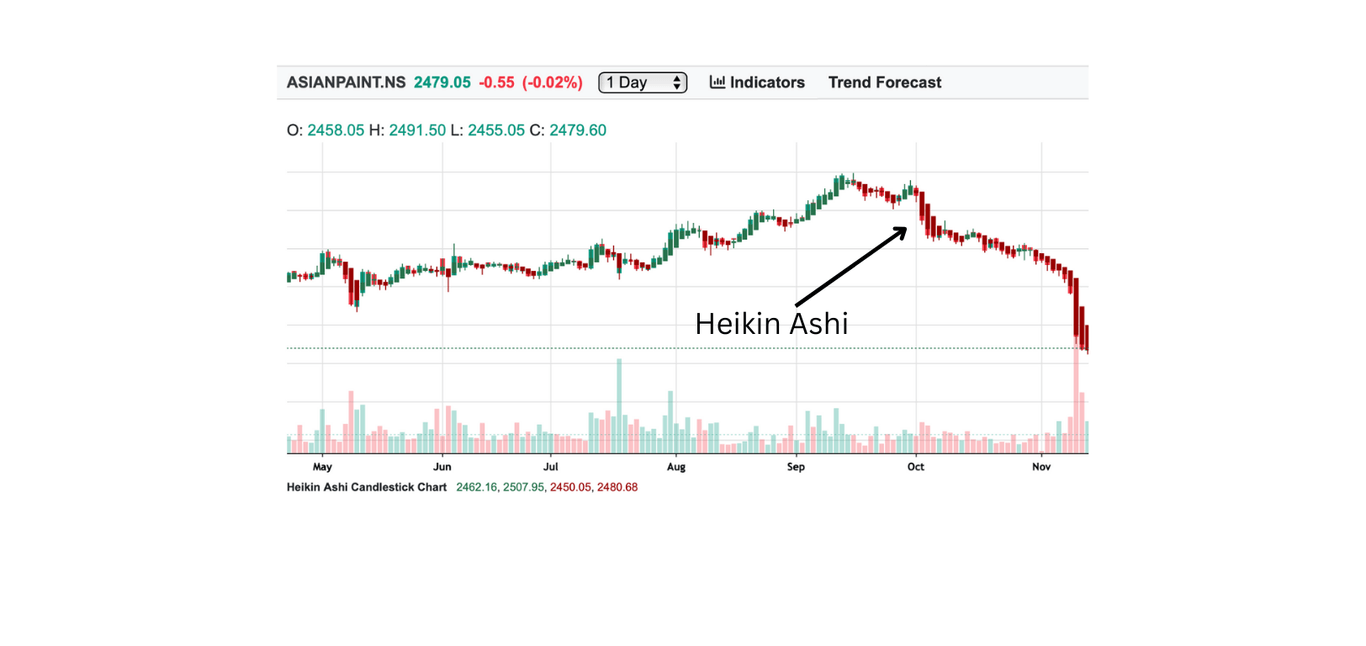
Heikin Ashi
Introduction: Heikin Ashi indicator helps trader to identify the trend of the stock’s prices by reducing the noise in the stock’s chart and give a visual insight of the trend in the stock’s chart itself.
Explanation: Heikin Ashi changes the candle sticks with the average prices over a particular time frame to remove noise and identify trends.
How to Use:
- Buy: When the Heikin Ashi candles changes from red to green.
- Sell: When Heiken Ashi candles changes from green to red.
Heikin Ashi Formula:
- Heikin Ashi Close:
(Open + High + Low + Close) / 4
- Heikin Ashi Open:
(Previous Heikin Ashi Open + Previous Heikin Ashi Close) / 2
- Heikin Ashi High:
Max(High, Heikin Ashi Open, Heikin Ashi Close)
- Heikin Ashi Low:
Min(Low, Heikin Ashi Open, Heikin Ashi Close)
Where:
- Open: The opening price of the current candlestick.
- High: The highest price during the current candlestick period.
- Low: The lowest price during the current candlestick period.
- Close: The closing price of the current candlestick.
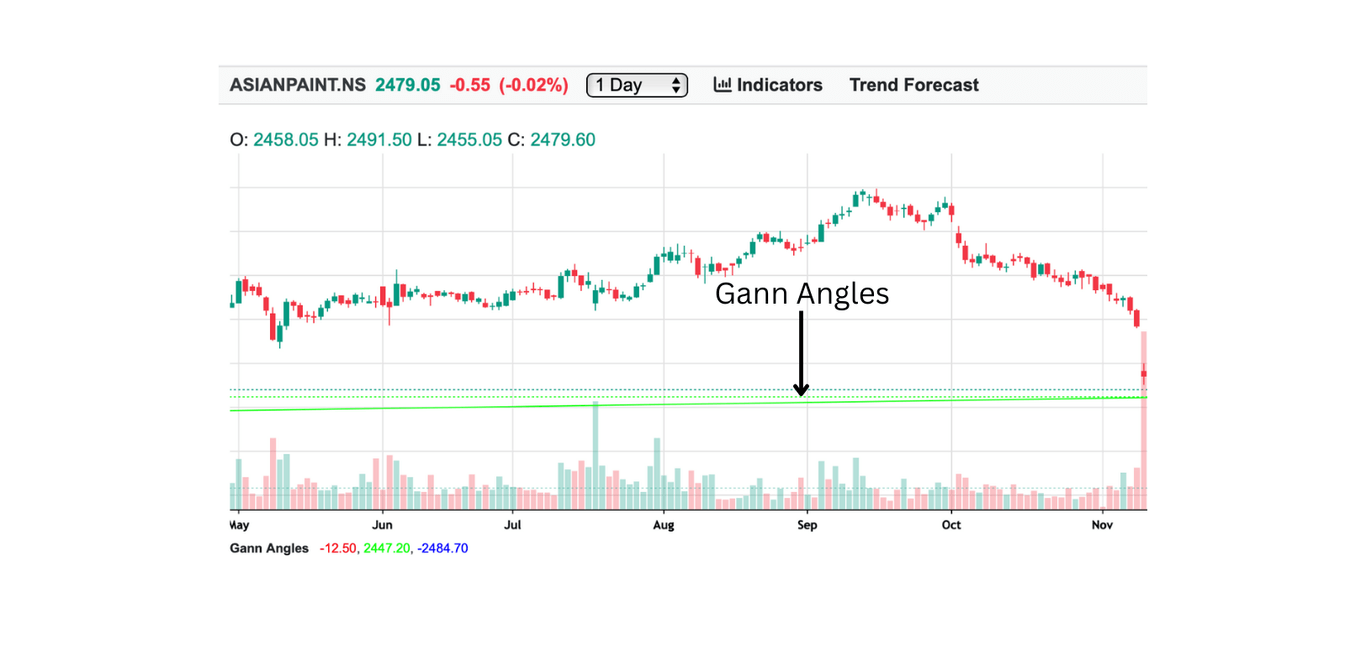
Gann Angles
Introduction: Gann angles helps traders to identify trends in stock’s price using relationship between price and time of a stock.
Explanation: Gann angles uses relationship between price and time and calculates a angle called gann angle which helps identifying support, resistance and trend of the stock’s price,for example if the gann angle is 45 degree it represent price is moving at a constant rate.
How to Use:
- Buy: When the Gann angles are acting as support and price is moving towards it.
- Sell: When the Gann angles are acting as resistance and price is moving towards it.
Gann Angles Formula:
- Angle of 1x1 (45-degree angle)
- Other Angles
1x1 Angle = (Price change) / (Time change)
Angle of n:x = (Price change) / (Time change)
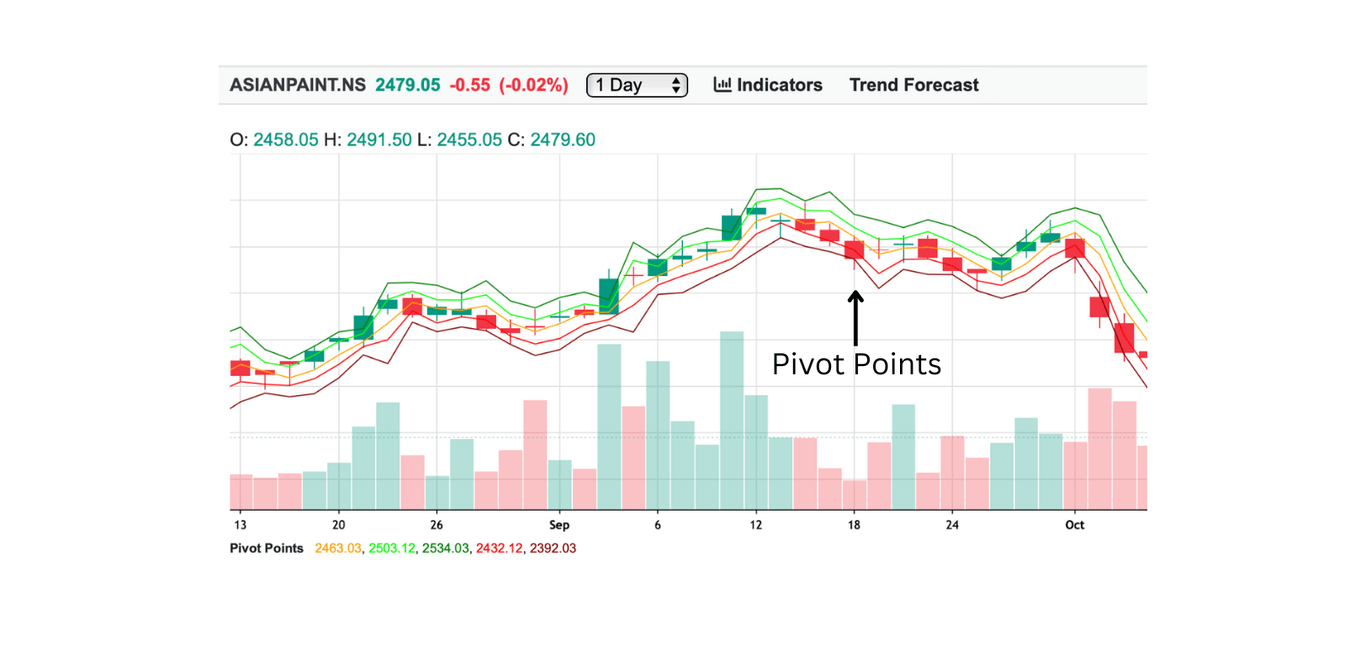
Pivot Points
Introduction: Pivot points are points in stock’s chart where trend reverses similar to support and resistance.
Explanation: Traders uses pivot points to determine possible trend reversal points to put entry and exit signals to utilise maximum potential of a trend from the beginning.
How to Use:
- Buy: If the current price has reached pivot point following a down-trend, then there is good possibility of trend reversal to up-trend.
- Sell: f the current price has reached pivot point following a up-trend, then there is good possibility of trend reversal to down-trend.
Pivot Points Formula:
- Pivot Point (P): The main pivot level.
- Support and Resistance Levels: Based on the pivot point, the support (S) and resistance (R) levels are calculated as:
- Resistance 1 (R1):
R1 = (2 × P) - Low - Support 1 (S1):
S1 = (2 × P) - High - Resistance 2 (R2):
R2 = P + (High - Low) - Support 2 (S2):
S2 = P - (High - Low) - Resistance 3 (R3):
R3 = High + 2 × (P - Low) - Support 3 (S3):
S3 = Low - 2 × (High - P)
P = (High + Low + Close) / 3
Where:
- High: The highest price during the previous period.
- Low: The lowest price during the previous period.
- Close: The closing price during the previous period.