Timeframes in Technical Analysis
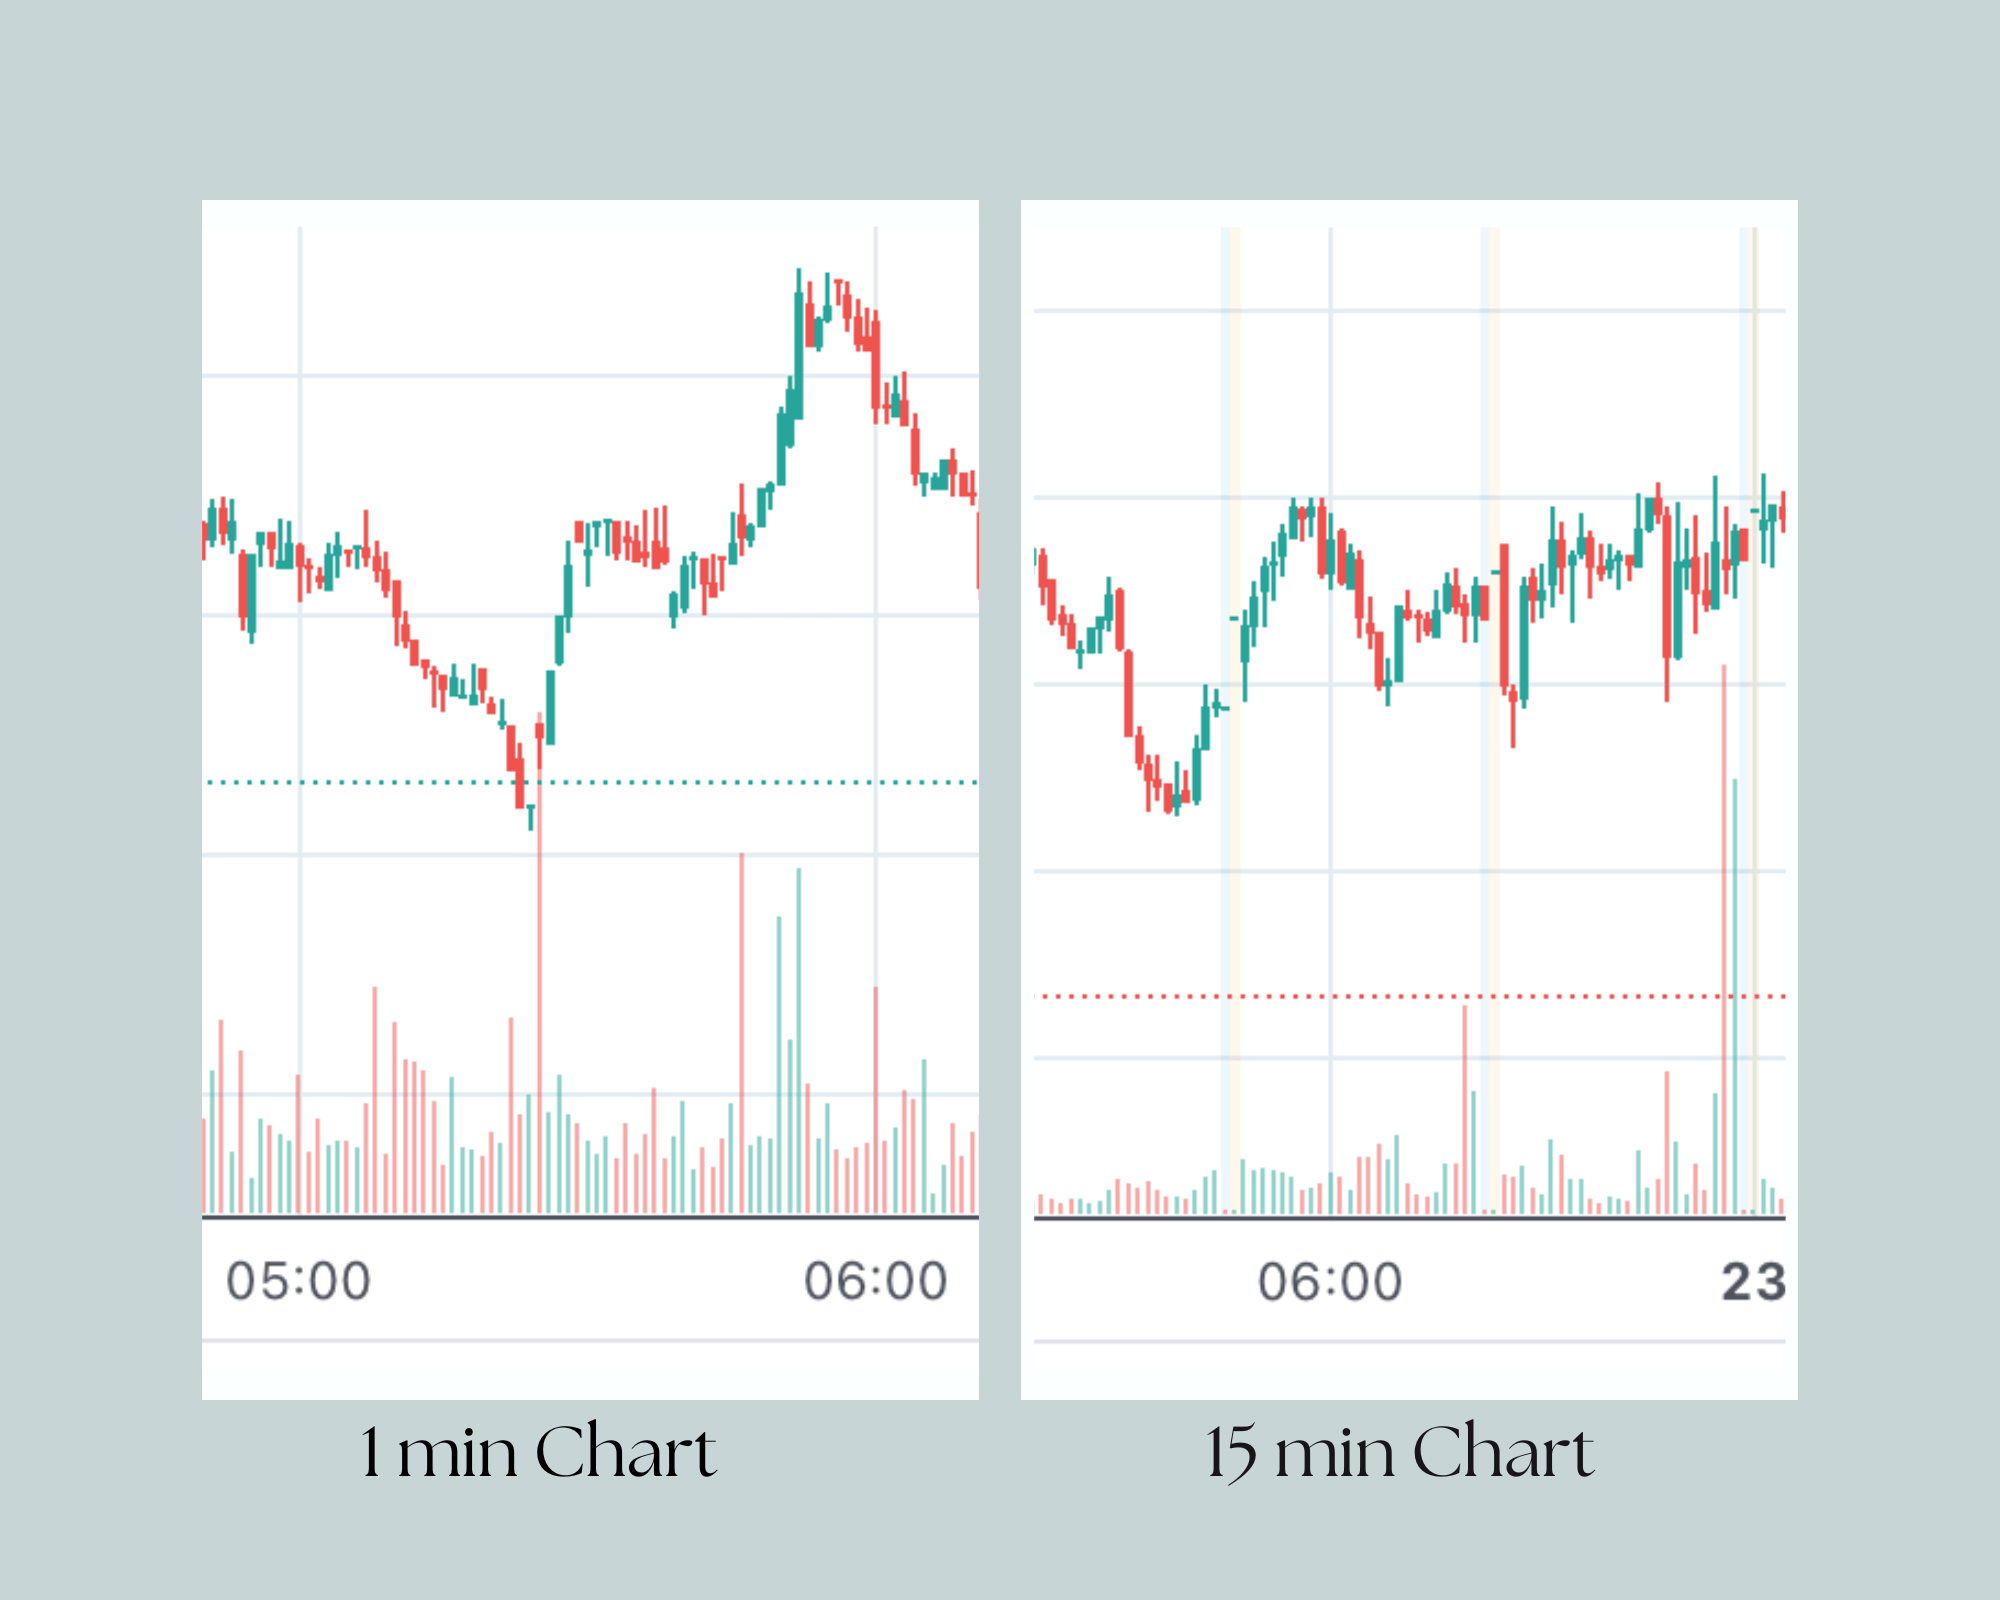
Intraday Charts (1 min, 5 min, 15 min)
This is used while analysis stock for short term trading strategies and these are used by mainly day traders.
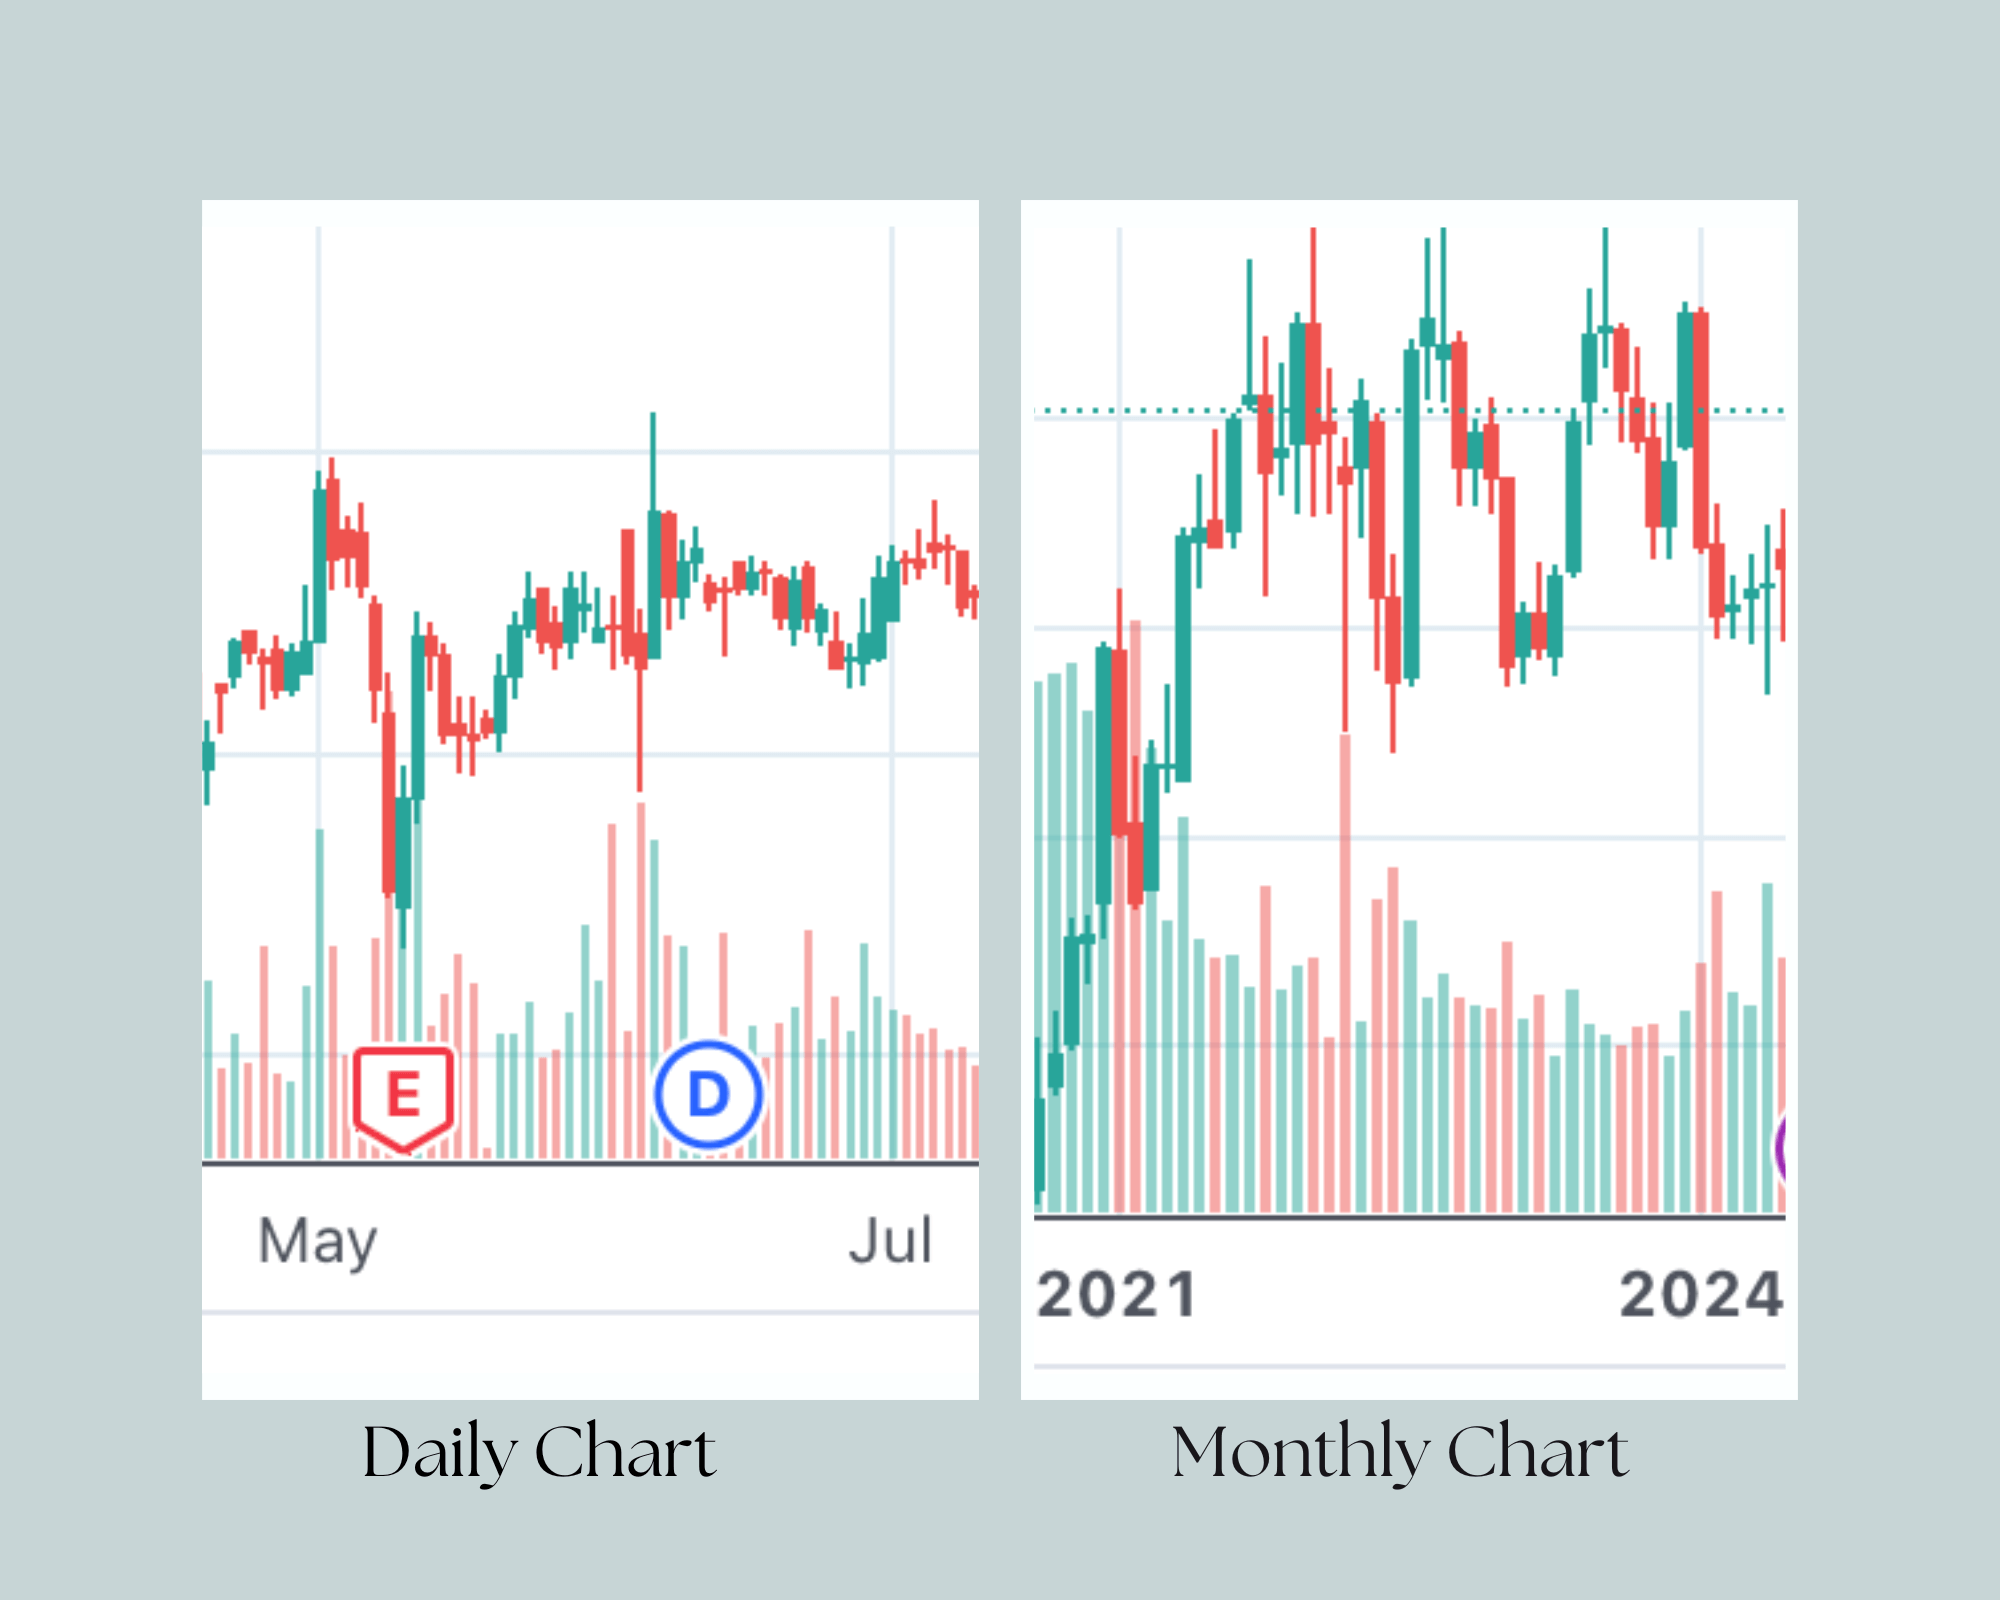
Daily, Weekly, and Monthly Charts
This is used for analysis of stock for long term perspective as this gives more detailed view on how stock is performing over the years.