What is Technical Analysis?
What Makes Technical and Fundamental Analysis Different?
- Technical Analysis: Analysing the stock’s past performance with help of candle charts, trading volumes and mathematically calculated technical indicators to estimate future possible trends.
- Fundamental Analysis: Analysing company’s real performance in terms of profits, revenues, debt , year on year growth also analysis of overall performance and predicted future growth of sector where this company belongs to and accessing if the company can perform well in the coming future to estimate future stock market trend specially in long term.
| Aspect | Technical Analysis | Fundamental Analysis |
|---|---|---|
| Definition | Analysis trends and patterns of stock’s historical stock market performance. | Analysis Company’s financial performance both current and over the past years |
| Focus | Understanding trend and pattern then predicting them. | Understanding company’s financial status and predicting company’s growth. |
| Objective | To predict short-term stock’s movement. | To predict long-term stock’s movement. |
| Time Horizon | Minutes to Weeks | Months to Years |
| Tools Used | Charts, Technical Indicators like RSI, Bollinger Bands. | Financial statement (Income Statement, Profit and loss statement). |
| Risk Level | High specially at the time of un-expected events (like wars or pandemic) as stock does not behave as per set pattern. | Majorly low but it may get high in case of unexpected company’s bankruptcy or scams or irrelevant product for coming future. |
| Best For | Traders who don’t want to risk their funds for very long time. | Investors who trusts on the services or products of the company and their relevancy in the coming future |
How Technical Analysis Helps Traders
It helps traders to understand the trend and seasonality in the stock’s chart pattern and identify entry and exit point.
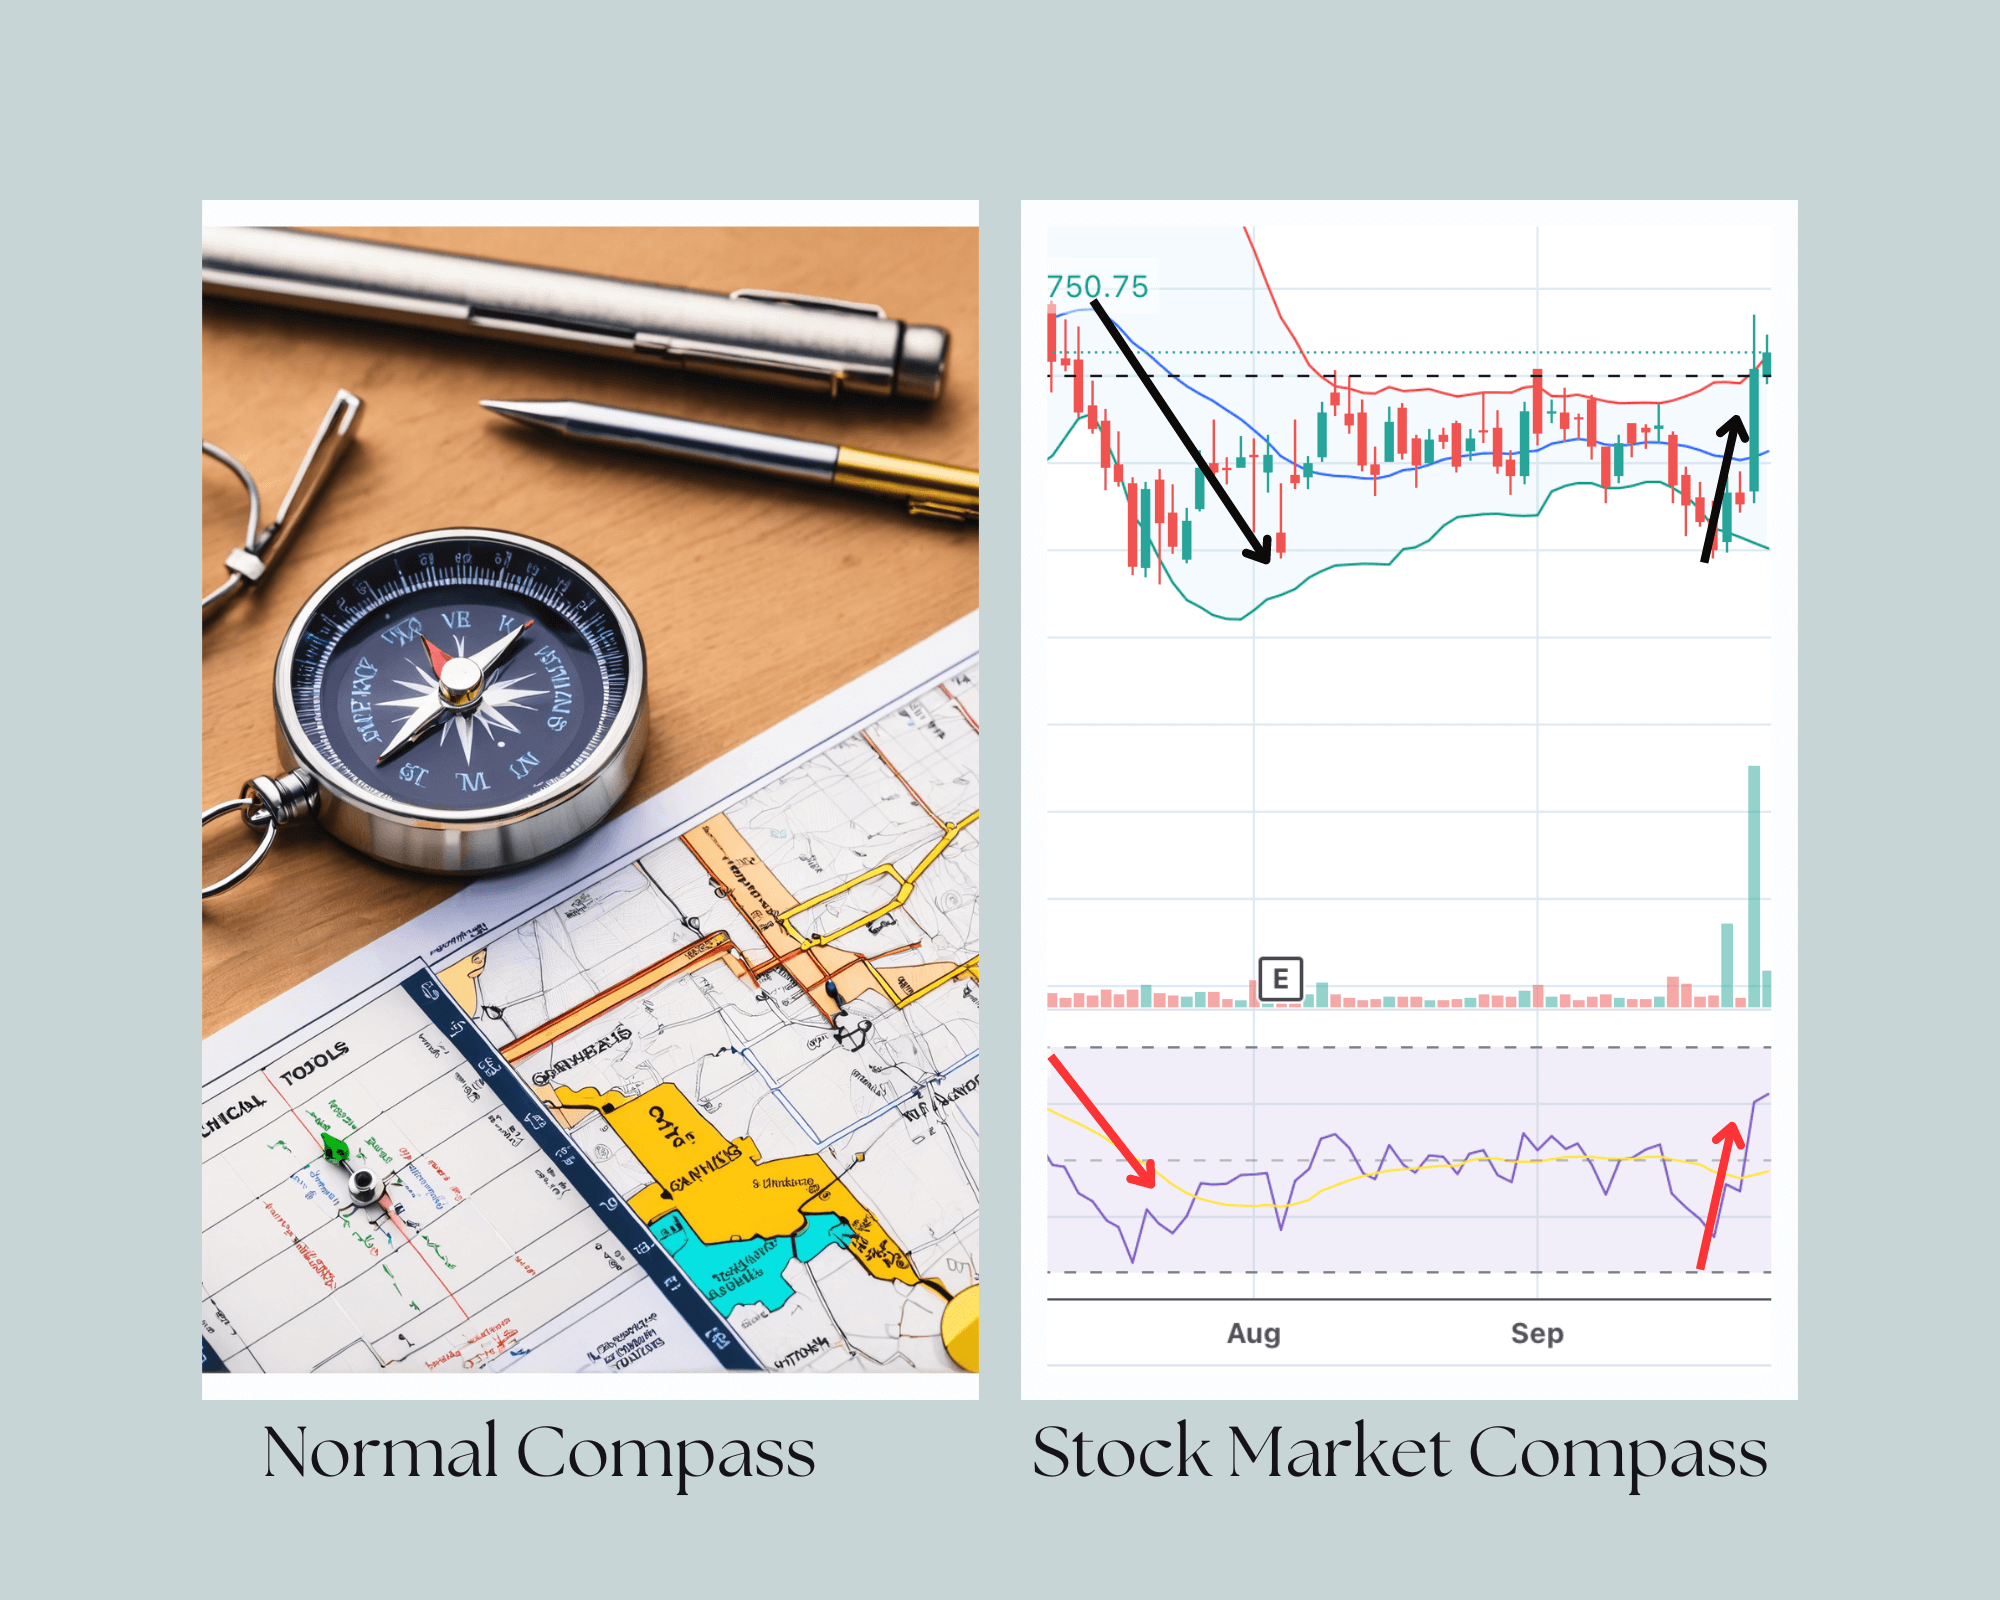
Example: Technical Analysis is like compass of stock market which helps traders to determine where will the market proceed in the future.