Reversal Patterns
Introduction to Reversal Patterns
These type of patterns helps to predict potential reversal of the current stock’s trend, if stock is currently in a downtrend then it may predict the possibility of reversal of this trend.
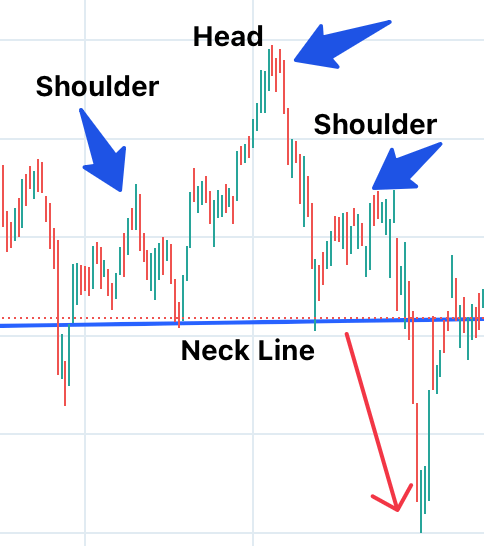
1. Head and Shoulders (Including Inverse Head and Shoulders)
What is it?
Like how the patterns of a person’s head and shoulder forms two small peaks and one large peak at the centre, this patterns also forms the similar shape of head and shoulder and predicts a reversal trend from uptrend to down trend near the bottom of the second shoulder of the patterns.
How to Spot It?
Look for the pattern where stock is moving inside a channel but the peaks are not exactly consistent, the first peak is smaller compare to the next peak then it has the highest peak and then the next peak is again smaller, and this three inconsistent peak forms a pattern of head and shoulder.
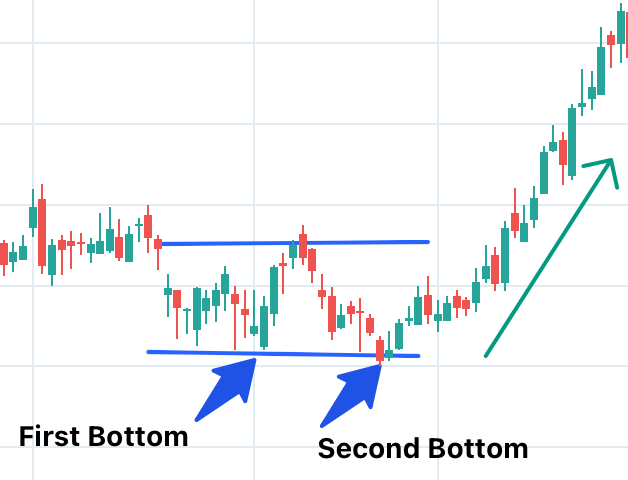
2. Double Top and Double Bottom
What is it?
Double top is a condition where a stock rises to a specific level and then falls twice at a specific level forming two peaks. It predicts the reversal from uptrend to downtrend. Similarly Double bottom is pattern where stock falls to a specific level and rises twice at a specific level, this predicts the reversal from downtrend to uptrend.
How to Spot It?
Look for the pattern where stock is moving inside a channel and the peaks are kind of exactly same twice forming a double top or double pattern.
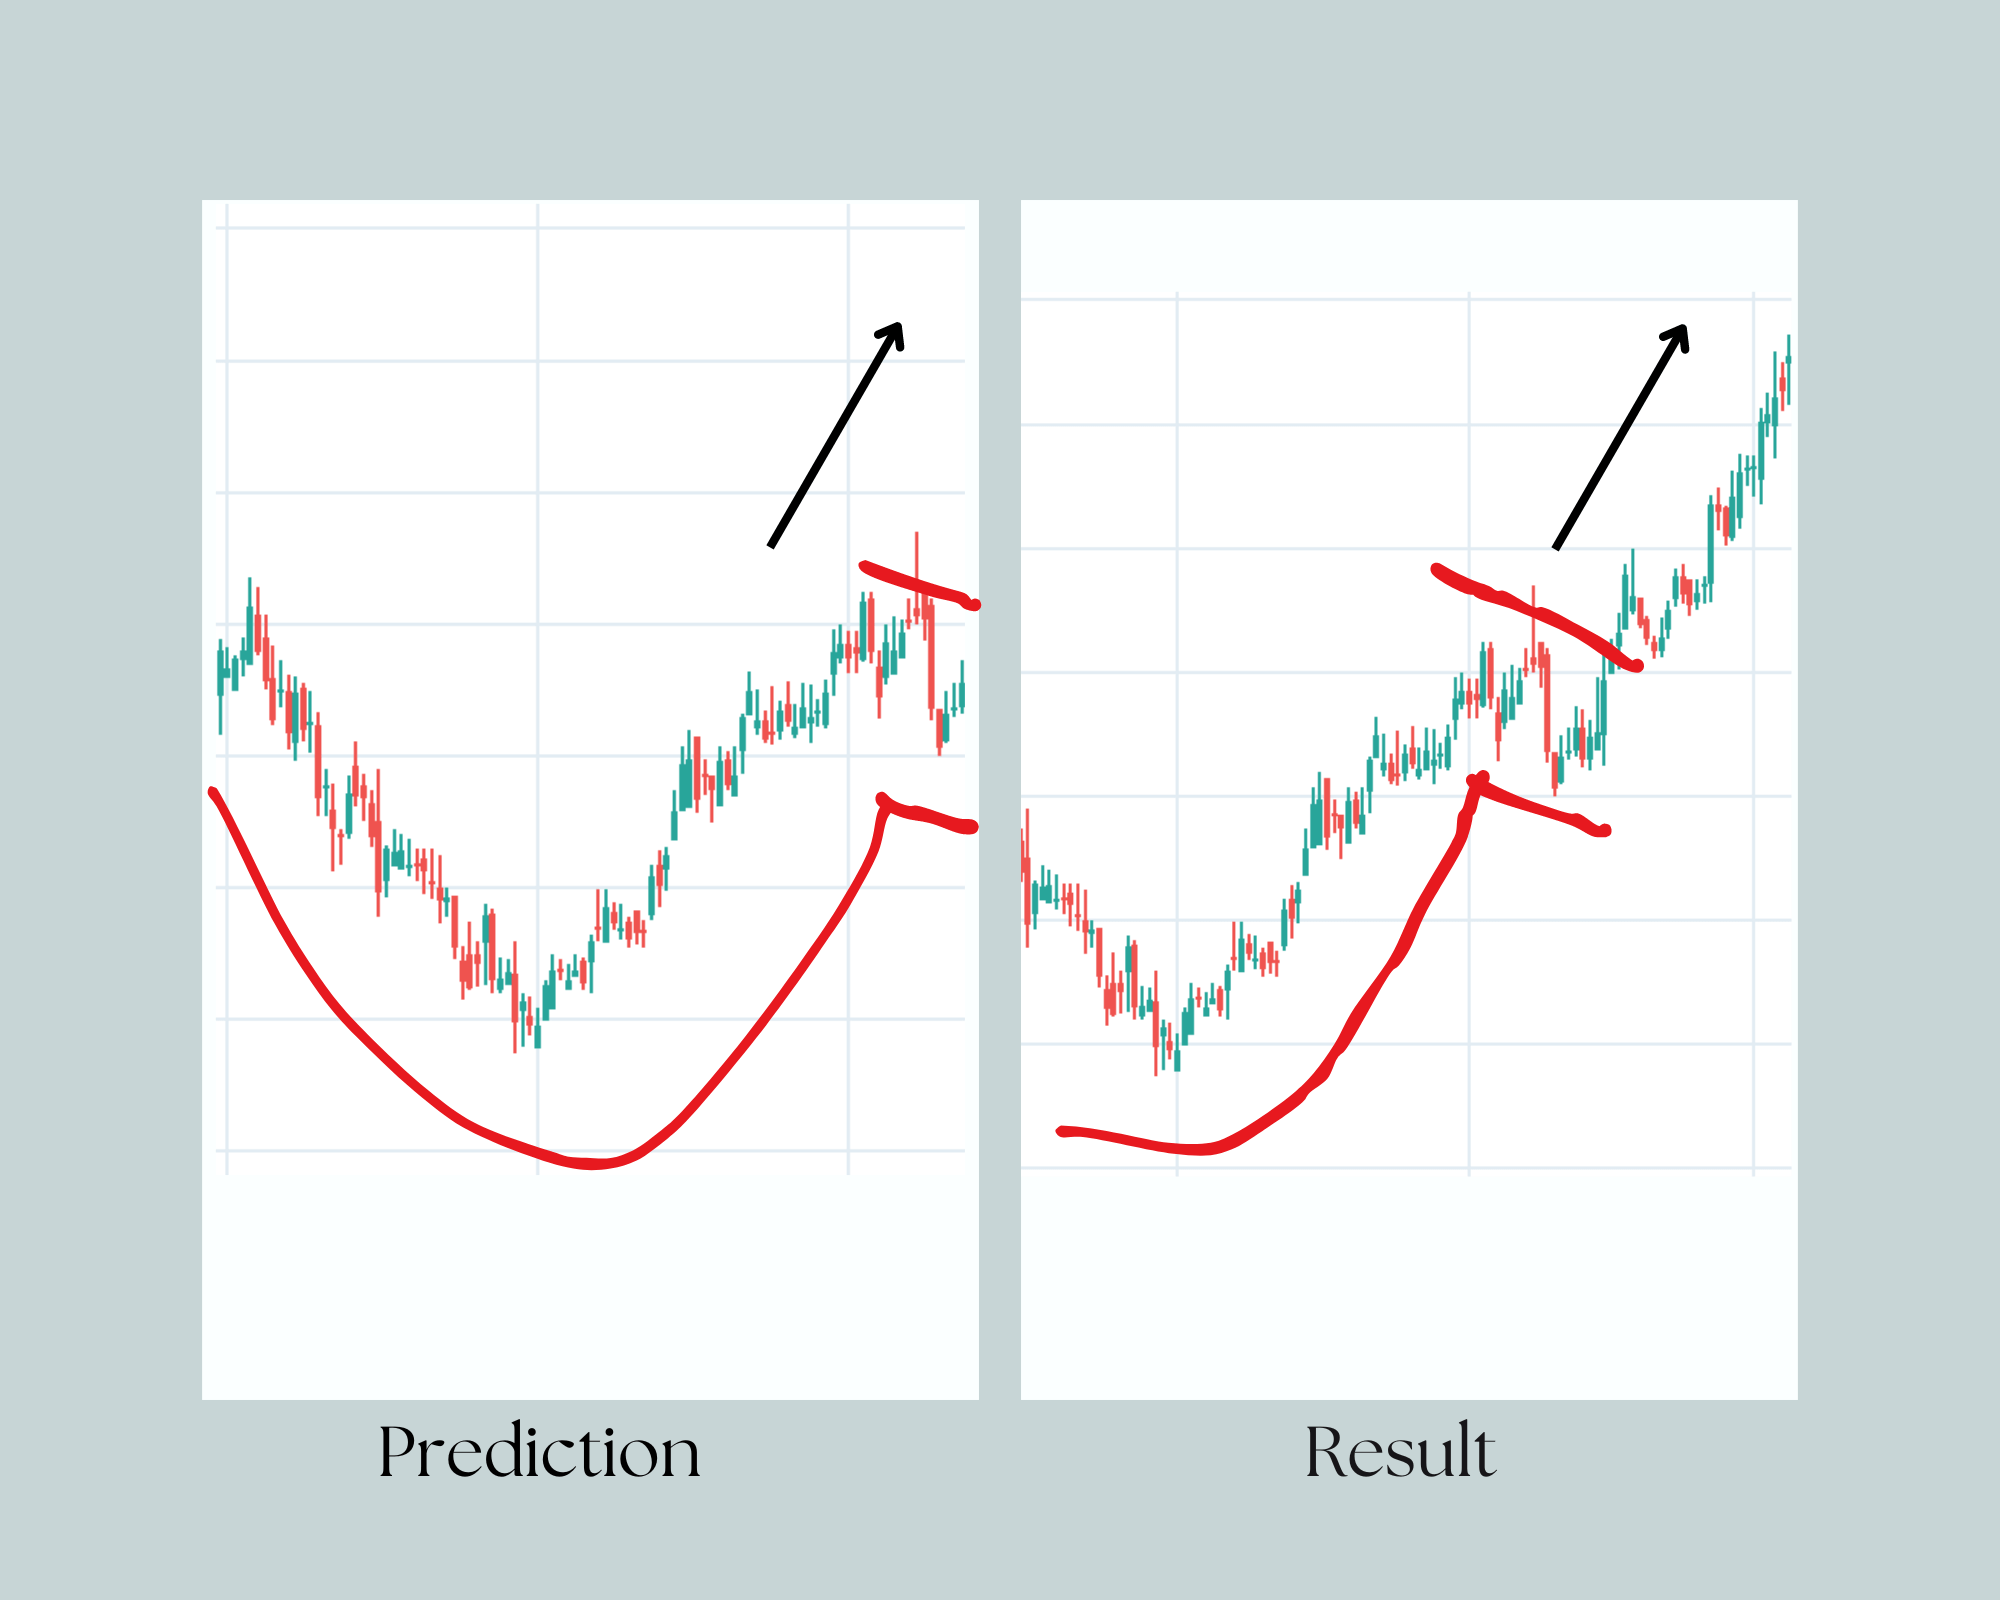
3. Cup and Handle
What is it?
The Cup and Handle pattern looks very similar to a coffee mug with handle, here the stock’s chart forms a curved pattern following a sideways trend which looks very similar to cup and handle. It predict the reversal from downtrend to uptrend at the end of the handle.
How to Spot It?
When the stock’s price is gradually falling at a slow rate then slowly goes up till a point where the downfall started then starts a side ways trend, this is what it looks like a cup and handle then it predicts a reversal to a possible uptrend at the end of the handle.