Momentum Indicators
RSI (Relative Strength Index)
Introduction: RSI (Relative Strength Index) as a momentum Indicator basically helps to identify if the stock is overvalued or undervalued for a particular period.
Terminologies:
- Overvalued: This indicates that the price of the stock has reached around it’s maximum value according to the recent trend and there is very less possibility that the price will continue to rise but a good possibility of trend reversal.
- Undervalued: This indicates that the price of the stock has reached around it’s minimum value according to the recent trend and there is very less possibility that the price will continue to fall but a good possibility of trend reversal.
Explanation: RSI ranges between 0 to 100, and let’s say a stock’s RSI is above 70 then it is considered overvalued and if it is less than 30 then it is undervalued for a particular time frame.
How to Use:
- When RSI is less than 30 as it is undervalued.
- When RSI is more than 70 as it is currently overvalued.
RSI Formula:
- Where:
- RS (Relative Strength): It is average of higher highs and lower lows for a particular timeframe.
RSI = 100 - (100 / (1 + RS))
.png)
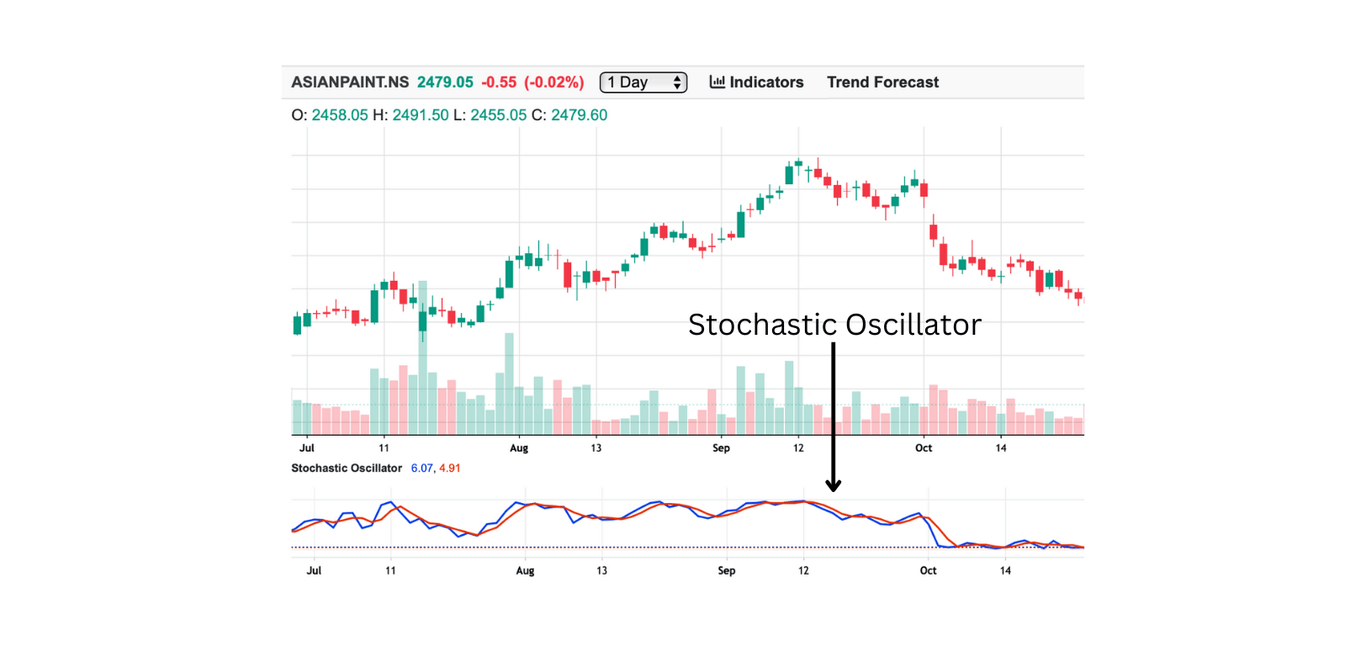
Stochastic Oscillator
Introduction: Similar to RSI ( Relative Strength Index) it is used to determine if the stock is overvalued or undervalued and it specially used for sideways market trend.
Terminologies:
- Oscillator: This is used to determine the range in the the stock’s price is moving.
Explanation: Stochastic Oscillator ranges between 0 to 100, and let’s say a stock’s Stochastic Oscillator is above 80 then it is considered overvalued and if it is less than 20 then it is undervalued for a particular time frame.
How to Use:
- Buy when Oscillator is less than 20 as it is undervalued.
- Sell when Oscillator is more than 80 as it is currently overvalued.
Stochastic Oscillator Formula:
- %K: The main and primary line of Stochastic Oscillator.
- %D: The %D line is a 3-day moving average of the %K line:
- Where:
- Current Close: Current price of a stock.
- Lowest Low: The lowest price in a particular period.
- Highest High: The highest price in a particular period.
%K = (Current Close - Lowest Low) / (Highest High - Lowest Low) * 100
%D = 3-day moving average of %K
Commodity Channel Index (CCI)
Introduction: The Commodity Channel Index (CCI)) measures how far a stock's price has moved from its historical average. It recognises overbought or oversold conditions.
Explanation: CCI helps traders to determine how is the current value of the stock is as compared to it’s moving average for a specific time period, if the CCI is above 100 it indicates that the stock is overvalued and if it is below -100 then it is undervalued.
How to Use:
- Buy when CCI is less than -100 as it is undervalued
- Sell when RSI is more than 100 as it is currently overvalued
CCI Formula:
- Where:
- Typical Price:
Typical Price = (High + Low + Close) / 3
CCI = (Typical Price - Moving Average) / (0.015 * Mean Deviation)
.png)
Williams %R (Williams Percent Range)
Introduction: Similar to RSI ( Relative Strength Index) it is used to determine if the stock is overvalued or undervalued and it specially used for short-term intervals.
Explanation: Williams %R ranges between -100 to 0, and let’s say a stock’s Williams %R is above -20 then it is considered overvalued and if it is less than -80 then it is undervalued for a particular time frame.
How to Use:
- Buy when Oscillator is less than -80 as it is undervalued.
- Sell when Oscillator is more than -20 as it is currently overvalued.
Williams %R Formula:
- Formula:
- Where:
- High: It is the highest high for a particular period.
- Low: It is lowest low for a particular period.
- Close: It is the current price of the stock.
Williams %R = [(High - Close) / (High - Low)] × -100
.png)
TRIX (Triple Exponential Average)
Introduction: TRIX is a indicators which shows the rate of change of a smoothed moving average ( Triple exponential moving average) so that traders can determine the potential trend reversal.
Terminologies:
- Triple Exponential Moving Average: Type of moving average which is smoothed multiple times to lessen the noise and variance.
Explanation: TRIX between -1 and 1 and if the TRIX for a stock is positive then it is considered as overvalued while a negative TRIX indicates undervalued stock.
How to Use:
- Buy when TRIX is less than 0 as it is undervalued.
- Sell when TRIX is more than 0 as it is currently overvalued.
TRIX Formula:
- Step 1: Calculate Exponential Moving Average (EMA) for a stock’s price for a particular time period.
- Step 2: Calculate EMA of above calculated EMA (in step 1).
- Step 3: Calculate EMA of above calculated EMA (in step 2).
TRIX = [(Triple EMAtoday - Triple EMAyesterday) / Triple EMAyesterday] × 100
.png)
Chande Momentum Oscillator (CMO)
Introduction: Similar to RSI ( Relative Strength Index) it is used to determine if the stock is overvalued or undervalued and it specially used for volatile markets.
Explanation: CMO ranges between -100 to 100, and let’s say a stock’s CMO is above 50 then it is considered overvalued and if it is less than -50 then it is undervalued for a particular time frame.
How to Use:
- Buy when CMO is less than -50 as it is undervalued.
- Sell when CMO is more than 50 as it is currently overvalued.
CMO Formula:
- Where:
- SU (Sum of Gains): It is sum of only positive price changes over a certain Period.
- SD (Sum of Losses): It is sum of only negative price changes over a certain Period
CMO = [(SU - SD) / (SU + SD)] × 100
.png)
Rate of Change (ROC)
Introduction: It is the change in the price of the stock over a certain period. Traders use this to determine how is the stock’s price is growing or declining as compared it’s past values.
Explanation: ROC Fluctuates around zero and traders use this to confirm or identify a trend as positive ROC indicates uptrend while negative ROC indicates downtrend.
How to Use:
- Buy when Roc moves from negative to positive.
- Sell when ROC moves from positive to negative
ROC Formula:
ROC = [(Current Price - Price n Periods Ago) / Price n Periods Ago] × 100
- n:It is number of days taken for calculation which is usually 10-14 days
.png)
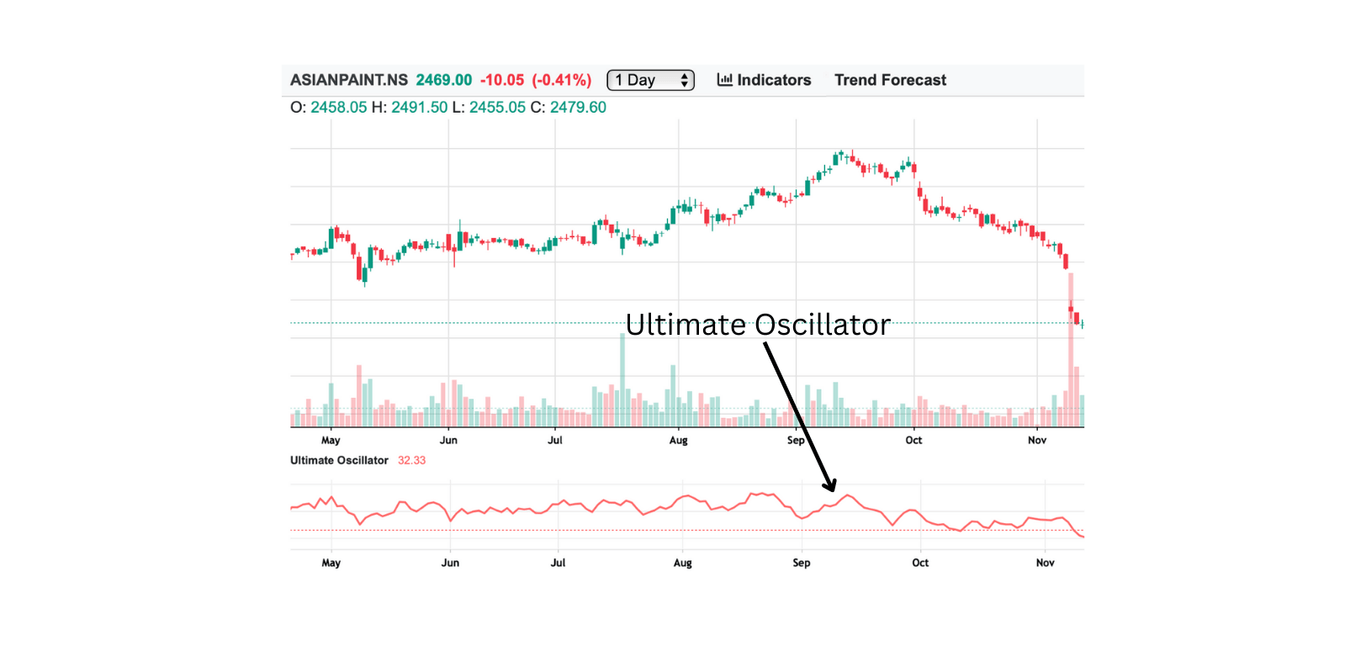
Ultimate Oscillator
Introduction: Ultimate oscillator uses three different timelines’s average to determine weather the stock’s price is overvalued or undervalued.
Explanation: Ultimate Oscillator swings between 0 to 100. If the value is more than 70 then the stock’s price is overvalued and if it is less than 30 then it is undervalued.
How to Use:
- Buy when Ultimate oscillator is rising and less than 30.
- Sell when Ultimate oscillator is falling and more than 70.
Ultimate Oscillator Formula:
- The Ultimate Oscillator is calculated as:
- Where:
- BP (Buying Pressure): Current Close - Minimum(Low or Previous Close)
- True Range (TR): Maximum(High or Previous Close) - Minimum(Low or Previous Close)
- 7-period, 14-period, 28-period averages: Exponential moving averages of BP/TR over the respective time periods.
Ultimate Oscillator = 100 × [(4 × Average(7-period BP/True Range)) + (2 × Average(14-period BP/True Range)) + (Average(28-period BP/True Range))] / (4 + 2 + 1)
Schaff Trend Cycle (STC)
Introduction: Schaff Trend Cycle is developed over MACD (Moving Average Convergence Divergence) to give traders insight on Momentum of a stock’s price.
Explanation: Schaff Trend Cycle (STC) swing between 0 to 100. STC as a momentum indicator helps traders to define weather a stock is overvalued or undervalued, where a value grater than 75 indicates stock’s price overvalued and value less than 25 indicates stock’s price is undervalued.
How to Use:
- Buy when Schaff Trend Cycle (STC) is rising and less than 25.
- Sell when Schaff Trend Cycle (STC) is falling and more than 75.
STC Formula:
- Step 1: Calculate the MACD Line:
- Step 2: Calculate the Signal Line:
- Step 3: Calculate the Stochastic of the MACD Line:
- Step 4: Apply an EMA to the Stochastic MACD to produce the STC:
Key Parameters:
- Fast Length: Typically, 12 periods.
- Slow Length: Typically, 26 periods.
- Signal Length: Typically, 9 periods.
- Cycle Length: Adjusted based on market conditions, e.g., 10 periods.
.png)
Relative Vigor Index (RVI)
Introduction: Relative Vigor Index ( RVI) basically calculates how is closing price changed as compared to the whole trading range to determine strength of a trend also the overvalued or undervalued conditions.
Explanation: RVI moves around zero, if the RVI’s value is positive then the Stock’s price is over valued or it has a uptrend and if the RVI’s value is negating then the stock’s price is undervalued or it is on a down trend.
How to Use:
- Buy when RVI moves from negative to positive
- Sell when RVI moves from positive to negative
RVI Formula:
- RVI: The Relative Vigor Index is calculated using the following formula:
- Where:
- Close: Closing price of the stock.
- Open: Opening price of the stock.
- High: Highest price of the stock during the period.
- Low: Lowest price of the stock during the period.
RVI = (Close - Open) / (High - Low)
KST (Know Sure Thing)
Introduction: KST ( Know Sure Thing) uses multiple rate of change for different time frames to determine the overall strength and direction of a trend.
Explanation: KST measure overall momentum of the stock using four different rate of change for different timeframes. If KST crosses above it’s signal line it indicates uptrend, if KST crosses below the signal line it indicates downtrend.
How to Use:
- Buy when KST is positive or crosses above it’s signal line.
- Sell when KST is negative or crosses below it’s signal line.
KST Formula:
- KST: The Know Sure Thing is calculated as follows:
- Signal Line: The signal line is a moving average (e.g., 9-period SMA) of the KST.
- Where:
- ROC1: Rate of Change over a short period (e.g., 10 days).
- ROC2: Rate of Change over a medium period (e.g., 15 days).
- ROC3: Rate of Change over a longer period (e.g., 20 days).
- ROC4: Rate of Change over a very long period (e.g., 30 days).
- SMA1, SMA2, SMA3, SMA4: Simple Moving Averages of each ROC over specific smoothing periods.
KST = (ROC1 × SMA1) + (ROC2 × SMA2) + (ROC3 × SMA3) + (ROC4 × SMA4)
.png)
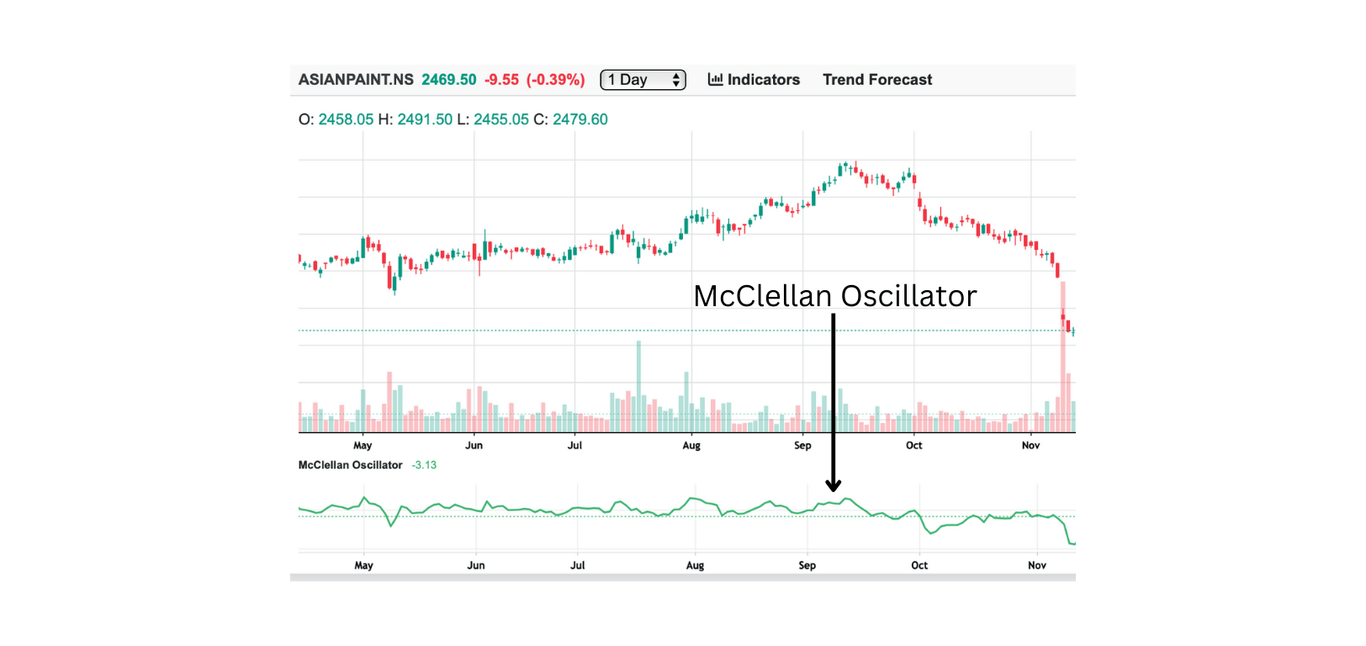
McClellan Oscillator
Introduction: It gives insight of the stock’s performance as compared to the whole Stock market, by analysing the difference between rising and falling stocks.
Explanation: When McClellan Oscillator when moves above zero it indicates uptrend and if it moves below zero then in indicates downtrend and if its at extreme ends it indicates overvalued or undervalued conditions.
How to Use:
- Buy when McClellan Oscillator moves above zero.
- Sell when McClellan Oscillator moves below zero.
Formula:
- The McClellan Oscillator is calculated as:
- Where:
- Advancers: The number of stocks advancing in price on a given day.
- Decliners: The number of stocks declining in price on a given day.
- 19-Day EMA: The exponential moving average of (Advancers - Decliners) over 19 days.
- 39-Day EMA: The exponential moving average of (Advancers - Decliners) over 39 days.
McClellan Oscillator = (19-Day EMA of (Advancers - Decliners)) - (39-Day EMA of (Advancers - Decliners))