Continuation Patterns
Introduction to Continuation Patterns
These type of patterns helps to predict the possibility current trend to continue further for example if the stock is currently in the uptrend then what is the probability that it will continue the same trend.
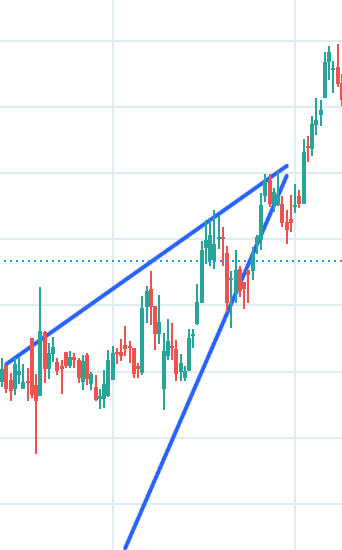
1. Ascending Triangle
What is it?
When the price of stock is rising making higher high and higher low, fluctuating inside a channel forms a triangle and at the end of this triangle predicts the continuation of the same uptrend.
How to Spot It? The condition is stock’s price is fluctuating inside a channel, channel is getting narrower with time, it is making higher high and higher low and stock is in uptrend then it confirms the Ascending triangle pattern.
2. Descending Triangle
What is it?
When the price of stock is falling making lower low and lower high, fluctuating inside a channel forms a triangle and at the end of this triangle predicts the continuation of the same downtrend.
How to Spot It? The condition is stock’s price is fluctuating inside a channel, channel is getting narrower with time, it is making lower low and lower high and stock is in downtrend then it confirms the Descending Triangle pattern.
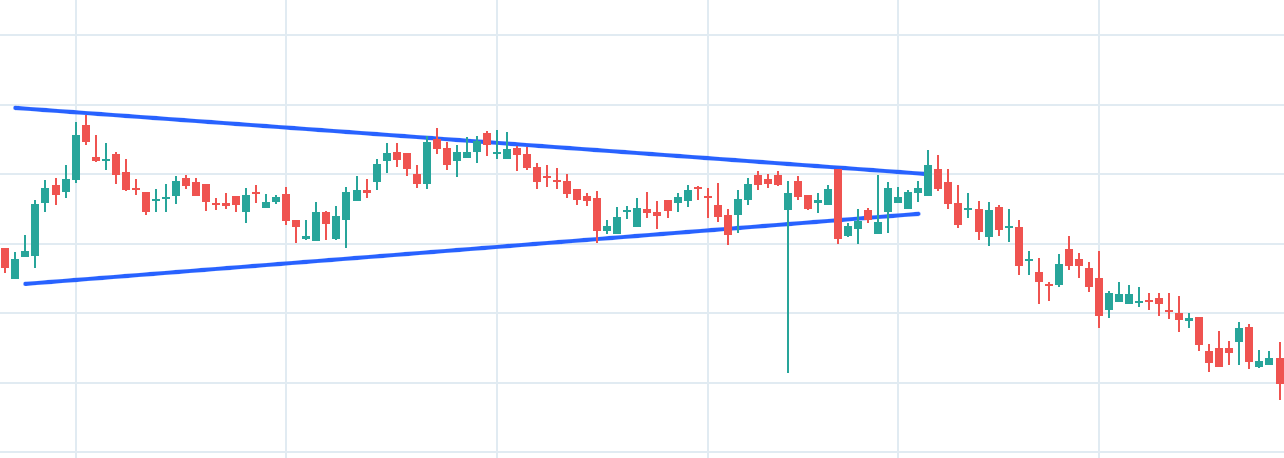
3. Symmetrical Triangle
What is it?
When the price of stock is moving side ways making lower high and higher low, fluctuating inside a channel which forms a triangle and at the end of this triangle predicts the stock’s price may break in any direction weather up or down
How to Spot It? The condition is stock’s price is fluctuating inside a channel, channel is getting narrower with time, it is making lower high and higher low and stock is in sideway trend then it confirms the Symmetrical Triangle pattern.
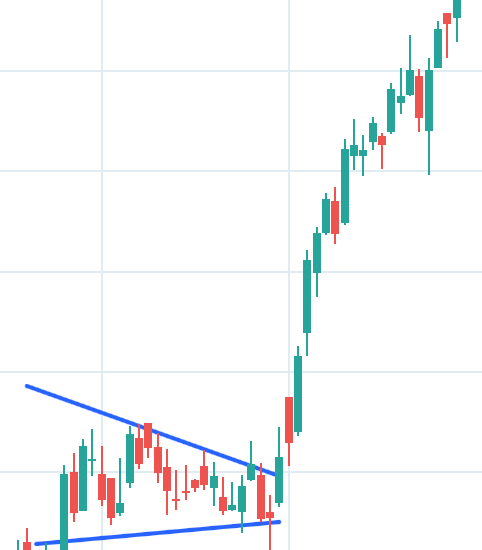
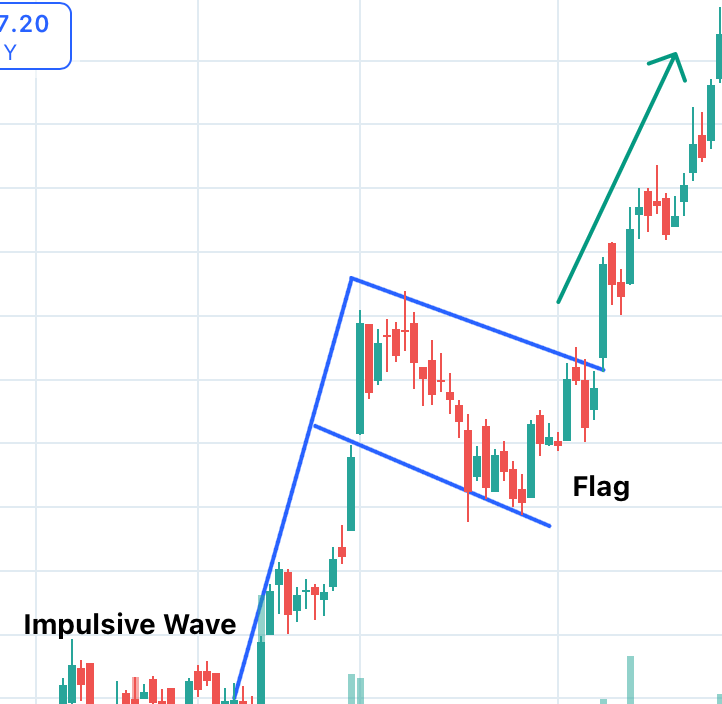
4. Bullish Flag
What is it?
This patterns resembles the shape of a upright flag with a pole where the strong uptrend of a stock’s price resemble the pole of the flag and a sideway trend after that resembles the flag pattern and it predict the continuation of the uptrend at the end of the sideway trend (Flag).
How to Spot It? Look for a stock who is in a sideway trend just after a steep uptrend which makes a formation of a upright flag with a pole which predicts at the end of the flag it may continue with the uptrend.
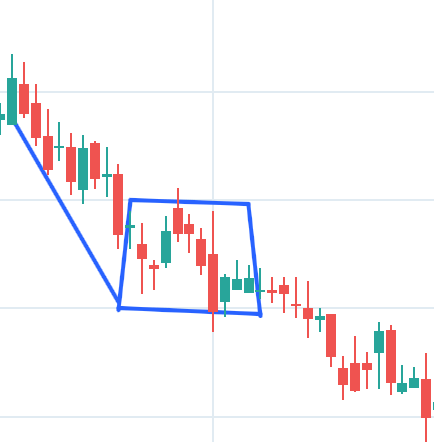
5. Bearish Flag
What is it?
This patterns resembles the shape of a opposite flag with a pole where the strong downtrend of a stock’s price resemble the pole of the flag and a sideway trend after that resembles the flag pattern and it predict the continuation of the downtrend at the end of the sideway trend (Flag).
How to Spot It? Look for a stock who is in a sideway trend just after a steep downtrend which makes a formation of a opposite flag with a pole which predicts at the end of the flag it may continue with the downtrend.