Chart Types
Line Chart, Bar Chart, Candlestick Chart
- Line Chart: Shows only one data point ( Close Value ) of stock over the period of time.
- Bar Chart: Shows all the data including Open, Close, High and low.
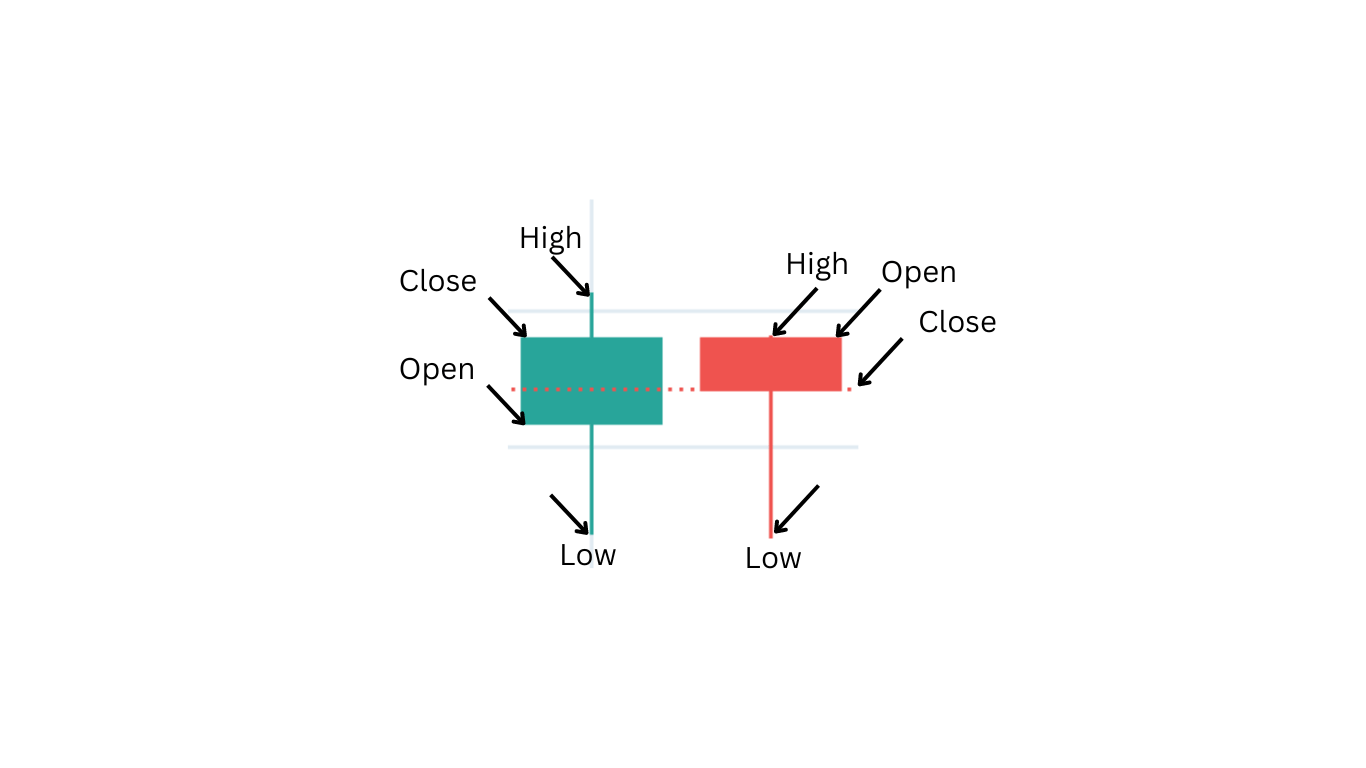
- Candlestick Chart: ike bar chart it shows all the data but in more structured way and it gets as much information as possible from one candlestick only
How to Read and Interpret Charts
Like real candlestick it has one main block and threads which is above and below the candle, top thread represent “High Value”, bottom most part of thread represent “Low Value” , top of candle block represent close value if candlestick is green, if it is red then top of candle block is open also if green bottom of block is open else if the candlestick is red then it is close.