Chart Patterns
Introduction to Chart Patterns
What are Chart Patterns?
Stock’s prices changes over time and to analyse those price changes traders look over the graphical representation of those price changes over a chart especially candle chart and over time the value of stock makes a special patterns or visual shapes over the chart which most of the time behave in predictable manner which is utilised by the traders who analyses those patterns and shapes and predict the probable future movements of the stock’s price.
Why are Chart Patterns Important?
Chart Patterns helps traders and investors to predict where can the price of stock probably go according to past behaviour, which helps traders to confirm their specific trading strategies and to decide target and stop loss values to prevent major losses as well as get most out of a single trade
How Do Chart Patterns Help Predict Price Movements?
As s stock’s value changes as per one simple process supply and demand, so when there is more demand price increases and when there is less demand for the particular stock the price falls, so as the stock go over this process for a long period of time it forms a specific patterns where at specific condition the demand will rise and after a specific period demand falls which makes stock’s price moment somewhat predictable, which is utilised by traders to decide when to buy and when to sell.
Types of Chart Patterns
There are two main types of chart patterns: Reversal and Continuation patterns.
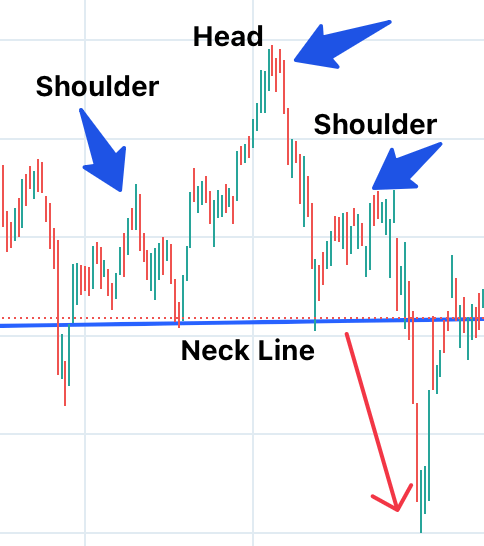
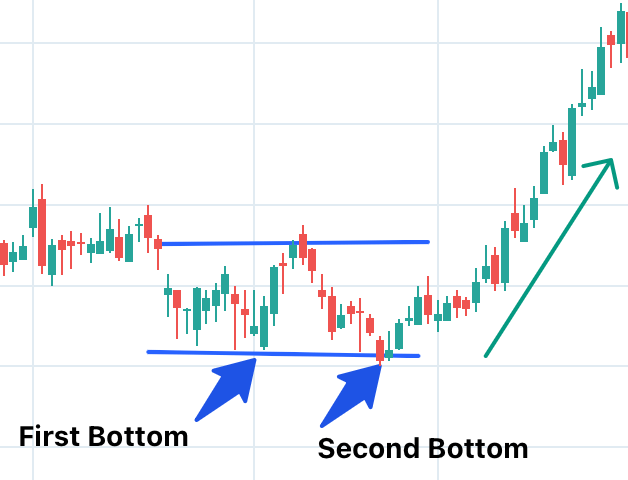
1. Reversal Patterns: hese type of patterns helps to predict potential reversal of the current stock’s trend, if stock is currently in a downtrend then it may predict the possibility of reversal of this trend.
- Example: Double Bottom (flags the price is going to ascend after fall).
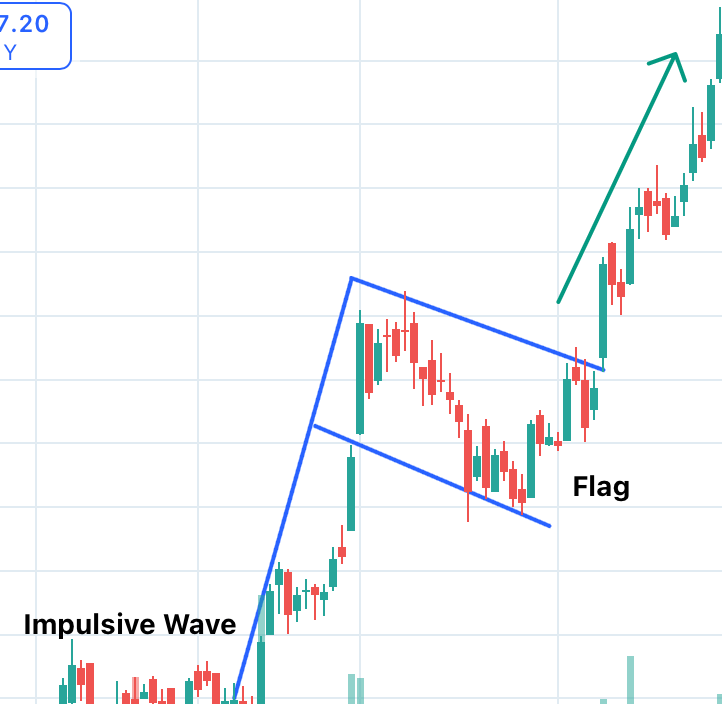
2. Continuation Patterns: These type of patterns helps to predict the possibility current trend to continue further for example if the stock is currently in the uptrend then what is the probability that it will continue the same trend.
- Example: Bullish Flag (flags a short delay before the price rises).