Candlestick Patterns
Introduction to Candlestick Patterns
Individual candles in a candlestick chart of a stock’s price gives a detailed overview of change in price of a stock for a given period. It shows open, high, low and close values using its height of candle, colour (Green or Red). Traders can predict future trend with the help of shape of an individual candle or combination of two to three neighbouring candles.
Let’s explore some of the most popular candlestick patterns
1. Doji
What is it?
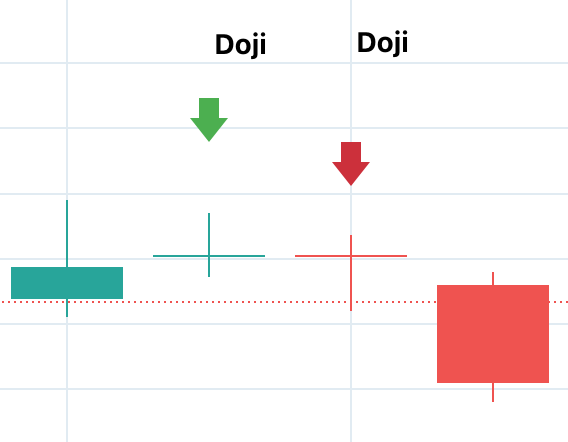
This is the pattern of a candlestick where it has very small or negligible body, it somewhat resembles a plus sign. This means that the open and close values are almost same which is why it have a negligible body. This also means that both buyers and sellers were equally powered for the particular timeframe and there is a good chance of trend reversal.
How to Spot It? Look for the candlestick where it has very small or negligible body or look for the very small difference between opening and closing price for the particular timeframe.
2. Hammer and Inverted Hammer
Hammer
What is it?
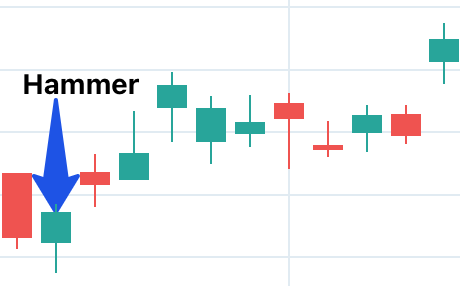
It is when a candlestick resembles the shape of upright hammer where it implies price went down a lot for a particular period but then move up for the profit and closes. If this happens during a downtrend there is a good probability of trend reversal to uptrend.
How to Spot It? A candlestick with long lower shadow and negligible upper shadow, also it is formed during a downtrend
Inverted Hammer
What is it?
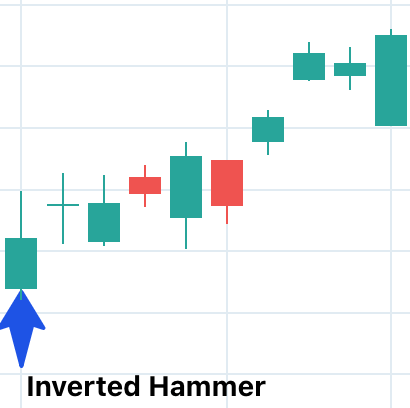
It is when a candlestick resembles the shape of inverted hammer where it implies price went up a lot for a particular period but then move down for the loss and closes. If this happens during a uptrend there is a good probability of trend reversal to downtrend.
How to Spot It? A candlestick with long upper shadow and negligible lower shadow, also it is formed during a uptrend
3. Engulfing Patterns (Bullish and Bearish)
Bullish Engulfing Pattern
What is it?
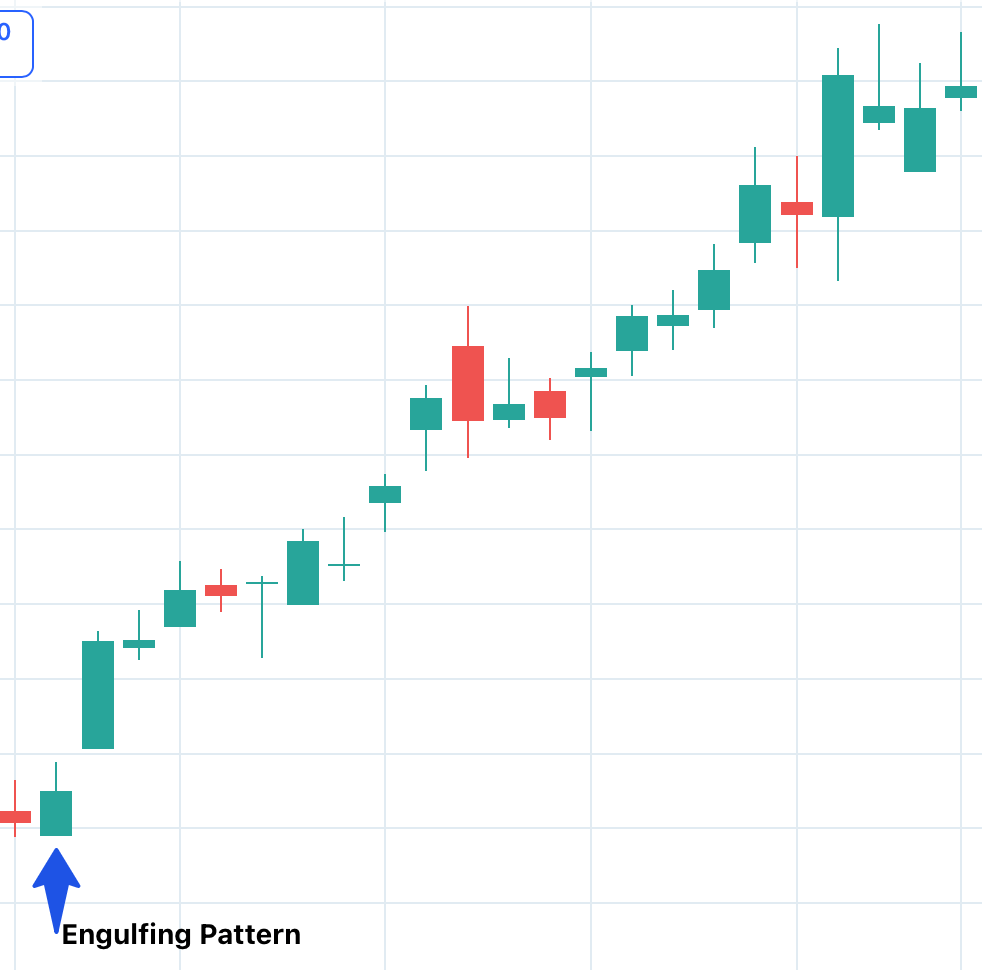
Bullish Engulfing Pattern forms when a small red candle is trailed by a large green candle which totally covers the previous red candle. This indicates a possible trend reversal from current downtrend to uptrend.
How to Spot It?
Look for a stock with down trend then try to find big green candles which is followed by a very small red candles indicating a possible trend reversal.
Bearish Engulfing Pattern
What is it?
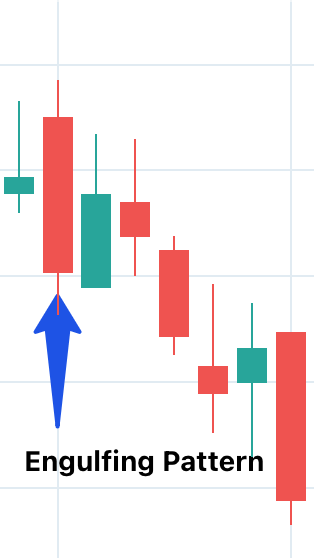
Bearish Engulfing Pattern forms when a small green candle is trailed by a large red candle which totally covers the previous green candle. This indicates a possible trend reversal from current uptrend to downtrend.
How to Spot It?
Look for a stock with uptrend then try to find big red candles which is followed by a very small green candles indicating a possible trend reversal.
4. Morning Star and Evening Star
Morning Star
What is it?
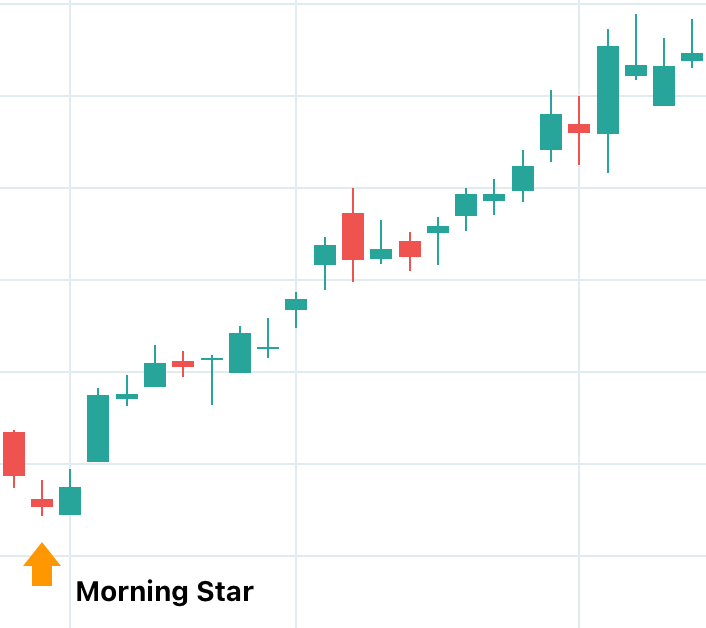
A morning star is the combination of three simultaneous candlestick first is big red candle next is a small candle very similar to dojo and last is big green candle, it indicates a possible trend reversal from downtrend to uptrend.
How to Spot It?
Look for stock which is currently in downtrend and it has a big green candle followed by a small doji which is followed by a big red candle, this confirms the formation of morning star.
Evening Star
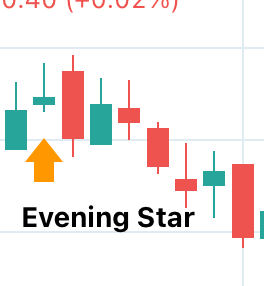
What is it?
An evening star is the combination of three simultaneous candlestick first is big green candle next is a small candle very similar to doji and last is big red candle, it indicates a possible trend reversal from uptrend to downtrend.
How to Spot It?
Look for stock which is currently in uptrend and it has a big red candle followed by a small doji which is followed by a big red candle, this confirms the formation of evening star.