| Ticker | Company | Sector | Date | Open | Close | High | Low | Volume |
|---|---|---|---|---|---|---|---|---|
| ESSARSHPNG.NS | Essar Shipping Limited | Industrials | April 3, 2025 | 24.00 | 25.05 | 25.05 | 23.71 | 117579.00 |
| PRITIKAUTO.NS | Pritika Auto Industries Limited | Industrials | April 3, 2025 | 16.80 | 16.94 | 17.15 | 16.58 | 190732.00 |
| GLOBALVECT.NS | Global Vectra Helicorp Limited | Industrials | April 3, 2025 | 258.00 | 259.33 | 264.25 | 250.02 | 6307.00 |
| GANGAFORGE.NS | Ganga Forging Limited | Industrials | April 3, 2025 | 4.94 | 4.94 | 4.94 | 4.94 | 86338.00 |
| HECPROJECT.NS | HEC Infra Projects Limited | Industrials | April 3, 2025 | 89.90 | 87.79 | 90.99 | 86.00 | 2212.00 |
| ATLANTAA.NS | Atlantaa Limited | Industrials | April 3, 2025 | 28.47 | 28.47 | 28.47 | 28.33 | 104.00 |
| DYNPRO.NS | Dynemic Products Limited | Basic Materials | April 3, 2025 | 281.60 | 278.05 | 290.00 | 275.00 | 25020.00 |
| BEML.NS | BEML Limited | Industrials | April 3, 2025 | 3071.40 | 3154.45 | 3180.00 | 3065.05 | 269337.00 |
| BIGBLOC.NS | Bigbloc Construction Limited | Industrials | April 3, 2025 | 64.47 | 66.35 | 67.42 | 64.26 | 235965.00 |
| JYOTISTRUC.NS | Jyoti Structures Limited | Industrials | April 3, 2025 | 16.75 | 17.10 | 17.29 | 16.70 | 7810490.00 |
| TARACHAND.NS | TARA CHAND INFRA SOLN LTD | Industrials | April 3, 2025 | 64.17 | 63.90 | 64.17 | 63.90 | 35910.00 |
| WENDT.NS | Wendt (India) Limited | Industrials | April 3, 2025 | 9505.50 | 9623.45 | 9921.85 | 9463.40 | 2064.00 |
| ULTRACEMCO.NS | UltraTech Cement Limited | Basic Materials | April 3, 2025 | 11189.00 | 11606.60 | 11650.05 | 11155.00 | 361851.00 |
| RAMCOCEM.NS | The Ramco Cements Limited | Basic Materials | April 3, 2025 | 916.65 | 941.40 | 953.00 | 900.00 | 1981820.00 |
| VINEETLAB.NS | Vineet Laboratories Limited | Basic Materials | April 3, 2025 | 33.78 | 36.82 | 38.80 | 33.78 | 172905.00 |
| KANPRPLA.NS | Kanpur Plastipack Limited | Consumer Cyclical | April 3, 2025 | 112.88 | 116.39 | 120.00 | 112.79 | 60755.00 |
| ASHIMASYN.NS | Ashima Limited | Consumer Cyclical | April 3, 2025 | 20.00 | 21.60 | 21.80 | 19.51 | 705346.00 |
| OLAELEC.NS | OLA ELECTRIC MOBILITY LTD | Consumer Cyclical | April 3, 2025 | 53.00 | 54.04 | 54.48 | 53.00 | 22378238.00 |
| BAJAJHIND.NS | Bajaj Hindusthan Sugar Limited | Consumer Defensive | April 3, 2025 | 19.26 | 19.62 | 19.82 | 19.06 | 6479468.00 |
| UCOBANK.NS | UCO Bank | Financial Services | April 3, 2025 | 30.29 | 30.38 | 31.11 | 29.81 | 28475334.00 |
| BAJAJHFL.NS | BAJAJ HOUSING FINANCE LTD | Financial Services | April 3, 2025 | 120.93 | 124.62 | 125.50 | 120.65 | 12167242.00 |
| UNIVPHOTO.NS | Universus Photo Imagings Limited | Healthcare | April 3, 2025 | 202.78 | 195.50 | 202.78 | 190.40 | 618.00 |
| LODHA.NS | Macrotech Developers Limited | Real Estate | April 3, 2025 | 1189.00 | 1217.75 | 1231.75 | 1175.15 | 732104.00 |
| VINATIORGA.NS | Vinati Organics Limited | Basic Materials | April 3, 2025 | 1555.00 | 1554.00 | 1579.50 | 1545.80 | 25914.00 |
| PIIND.NS | PI Industries Limited | Basic Materials | April 3, 2025 | 3470.00 | 3453.35 | 3477.90 | 3415.00 | 535423.00 |
| LINDEINDIA.NS | Linde India Limited | Basic Materials | April 3, 2025 | 6125.00 | 6167.50 | 6274.00 | 6125.00 | 16437.00 |
| UPL.NS | UPL Limited | Basic Materials | April 3, 2025 | 642.80 | 651.25 | 653.70 | 636.05 | 2635084.00 |
| DALBHARAT.NS | Dalmia Bharat Limited | Basic Materials | April 3, 2025 | 1816.90 | 1857.15 | 1883.35 | 1807.00 | 433600.00 |
| JSL.NS | Jindal Stainless Limited | Basic Materials | April 3, 2025 | 585.00 | 594.60 | 597.95 | 583.55 | 632428.00 |
| NMDC.NS | NMDC Limited | Basic Materials | April 3, 2025 | 69.10 | 70.43 | 70.98 | 69.00 | 23244833.00 |
| SAIL.NS | Steel Authority of India Limited | Basic Materials | April 3, 2025 | 117.30 | 118.54 | 119.63 | 116.84 | 14424524.00 |
| ACC.NS | ACC Limited | Basic Materials | April 3, 2025 | 1953.60 | 1994.85 | 1999.00 | 1950.50 | 163321.00 |
| FACT.NS | The Fertilisers and Chemicals Travancore Limited | Basic Materials | April 3, 2025 | 640.00 | 657.55 | 670.50 | 637.90 | 464059.00 |
| FLUOROCHEM.NS | Gujarat Fluorochemicals Limited | Basic Materials | April 3, 2025 | 3893.00 | 3874.55 | 3955.00 | 3851.15 | 105017.00 |
| COROMANDEL.NS | Coromandel International Limited | Basic Materials | April 3, 2025 | 2049.85 | 2060.50 | 2125.00 | 2020.00 | 626480.00 |
| DEEPAKNTR.NS | Deepak Nitrite Limited | Basic Materials | April 3, 2025 | 1998.90 | 2004.60 | 2030.00 | 1969.60 | 376997.00 |
| LLOYDSME.NS | Lloyds Metals and Energy Limited | Basic Materials | April 3, 2025 | 1326.00 | 1320.45 | 1349.00 | 1299.25 | 383538.00 |
| TATACHEM.NS | Tata Chemicals Limited | Basic Materials | April 3, 2025 | 843.30 | 849.90 | 854.45 | 841.00 | 208711.00 |
| JKCEMENT.NS | J.K. Cement Limited | Basic Materials | April 3, 2025 | 4892.60 | 4997.90 | 5021.00 | 4876.30 | 78956.00 |
| KANSAINER.NS | Kansai Nerolac Paints Limited | Basic Materials | April 3, 2025 | 239.99 | 242.82 | 244.44 | 238.12 | 106324.00 |
| BAYERCROP.NS | Bayer CropScience Limited | Basic Materials | April 3, 2025 | 4760.50 | 4932.40 | 4949.00 | 4753.40 | 30004.00 |
| NAVINFLUOR.NS | Navin Fluorine International Limited | Basic Materials | April 3, 2025 | 4247.60 | 4193.40 | 4337.45 | 3955.00 | 526876.00 |
| ATUL.NS | Atul Ltd | Basic Materials | April 3, 2025 | 5799.00 | 5618.25 | 5878.55 | 5601.00 | 37050.00 |
| SUMICHEM.NS | Sumitomo Chemical India Limited | Basic Materials | April 3, 2025 | 565.00 | 572.90 | 579.45 | 560.05 | 380621.00 |
| RAINBOW.NS | Rainbow Children's Medicare Limited | Healthcare | April 3, 2025 | 1370.00 | 1373.70 | 1390.30 | 1363.25 | 51268.00 |
| PGHL.NS | Procter & Gamble Health Limited | Healthcare | April 3, 2025 | 5260.00 | 5301.10 | 5330.00 | 5232.55 | 3788.00 |
| MEDPLUS.NS | MedPlus Health Services Limited | Healthcare | April 3, 2025 | 759.90 | 732.80 | 759.90 | 729.00 | 107429.00 |
| KOPRAN.NS | Kopran Limited | Healthcare | April 3, 2025 | 193.98 | 196.18 | 198.87 | 192.54 | 201640.00 |
| SMSPHARMA.NS | SMS Pharmaceuticals Limited | Healthcare | April 3, 2025 | 220.00 | 228.01 | 229.00 | 220.00 | 187610.00 |
| LINCOLN.NS | Lincoln Pharmaceuticals Limited | Healthcare | April 3, 2025 | 564.60 | 574.10 | 588.00 | 564.60 | 110907.00 |
Summary
Screener is a simple yet powerful tool for filtering stocks in the stock market.
In the stock market we have more than 5000 stocks, two main markets, NSE (National Stock Exchange) and BSE (Bombay Stock Exchange), and more than 10 sectors, so it becomes very confusing to select perfect stocks to buy.
Investors have multiple criteria, both fundamental and technical, under which they trade stocks; for example, short-term traders prefer stocks that have an RSI value between 20 and 30, and long-term investors prefer a PE ratio below 30 and above 10, but checking each 5000 stocks manually for RSI or PE ratio is not possible.
Which is why we have built this, one of India’s best stock screeners for the stock market where investors can define their criterion and apply filters to have a filtered list of stocks according to investor’s strategy.
How to use this screener.
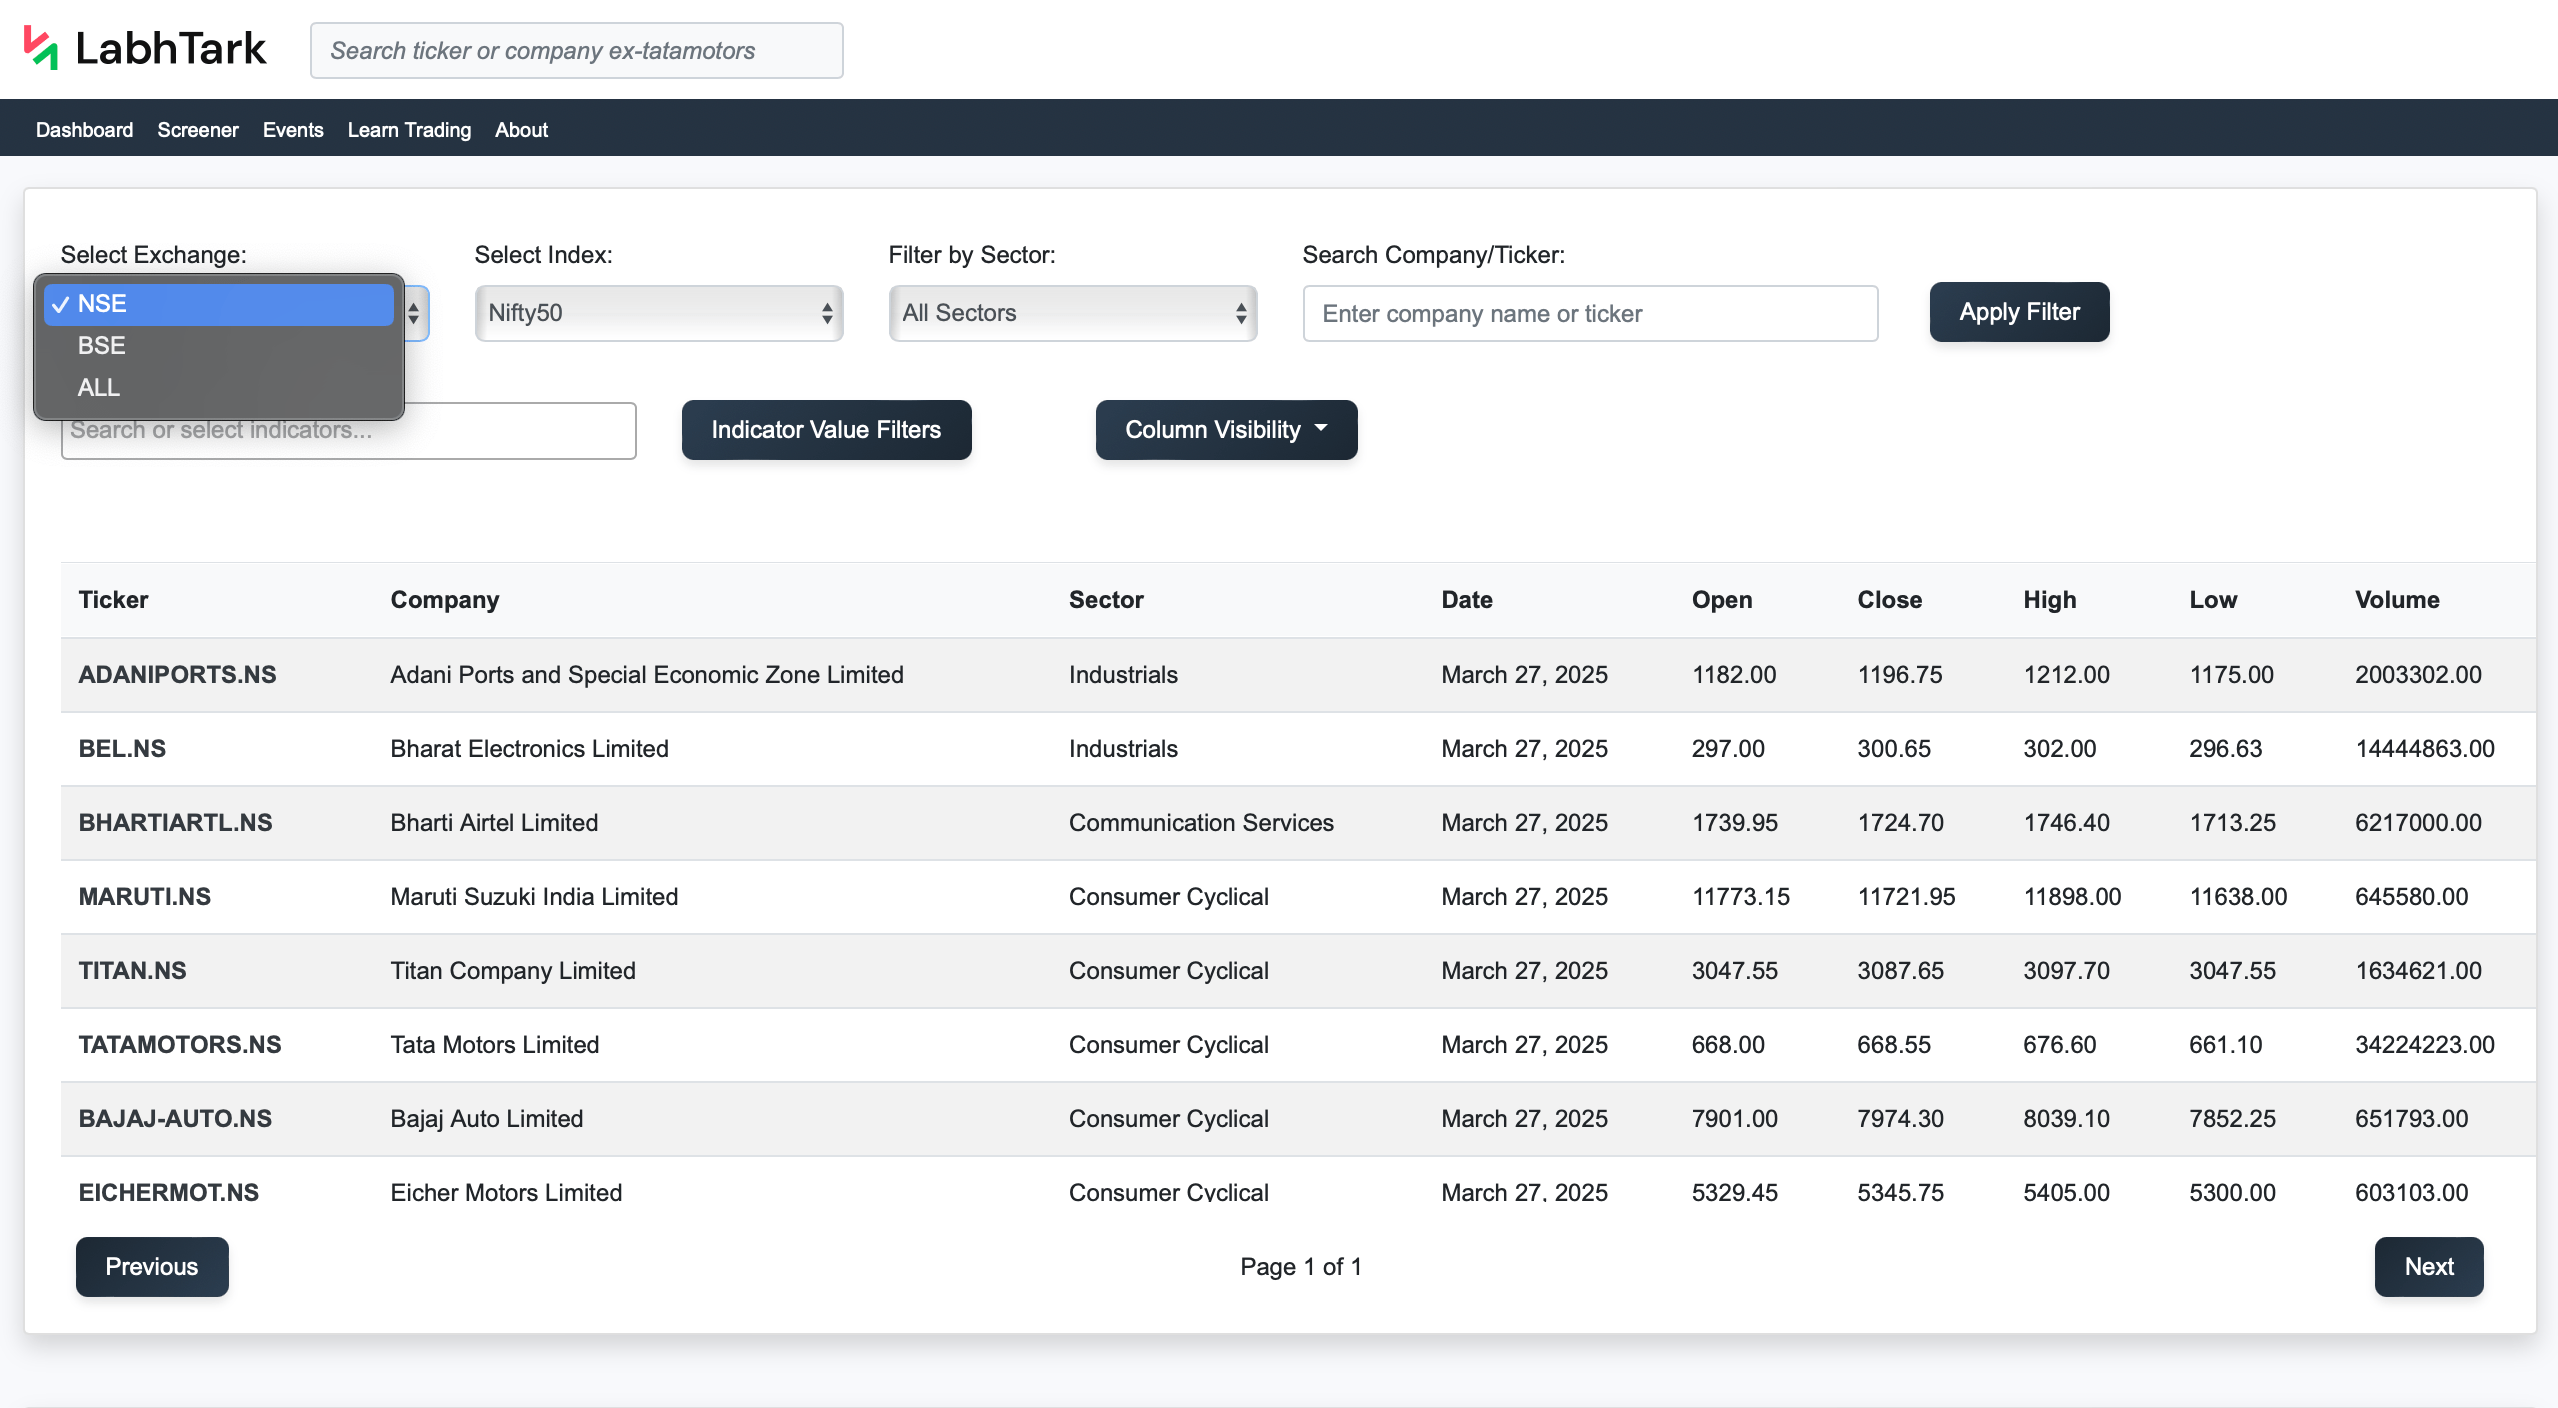
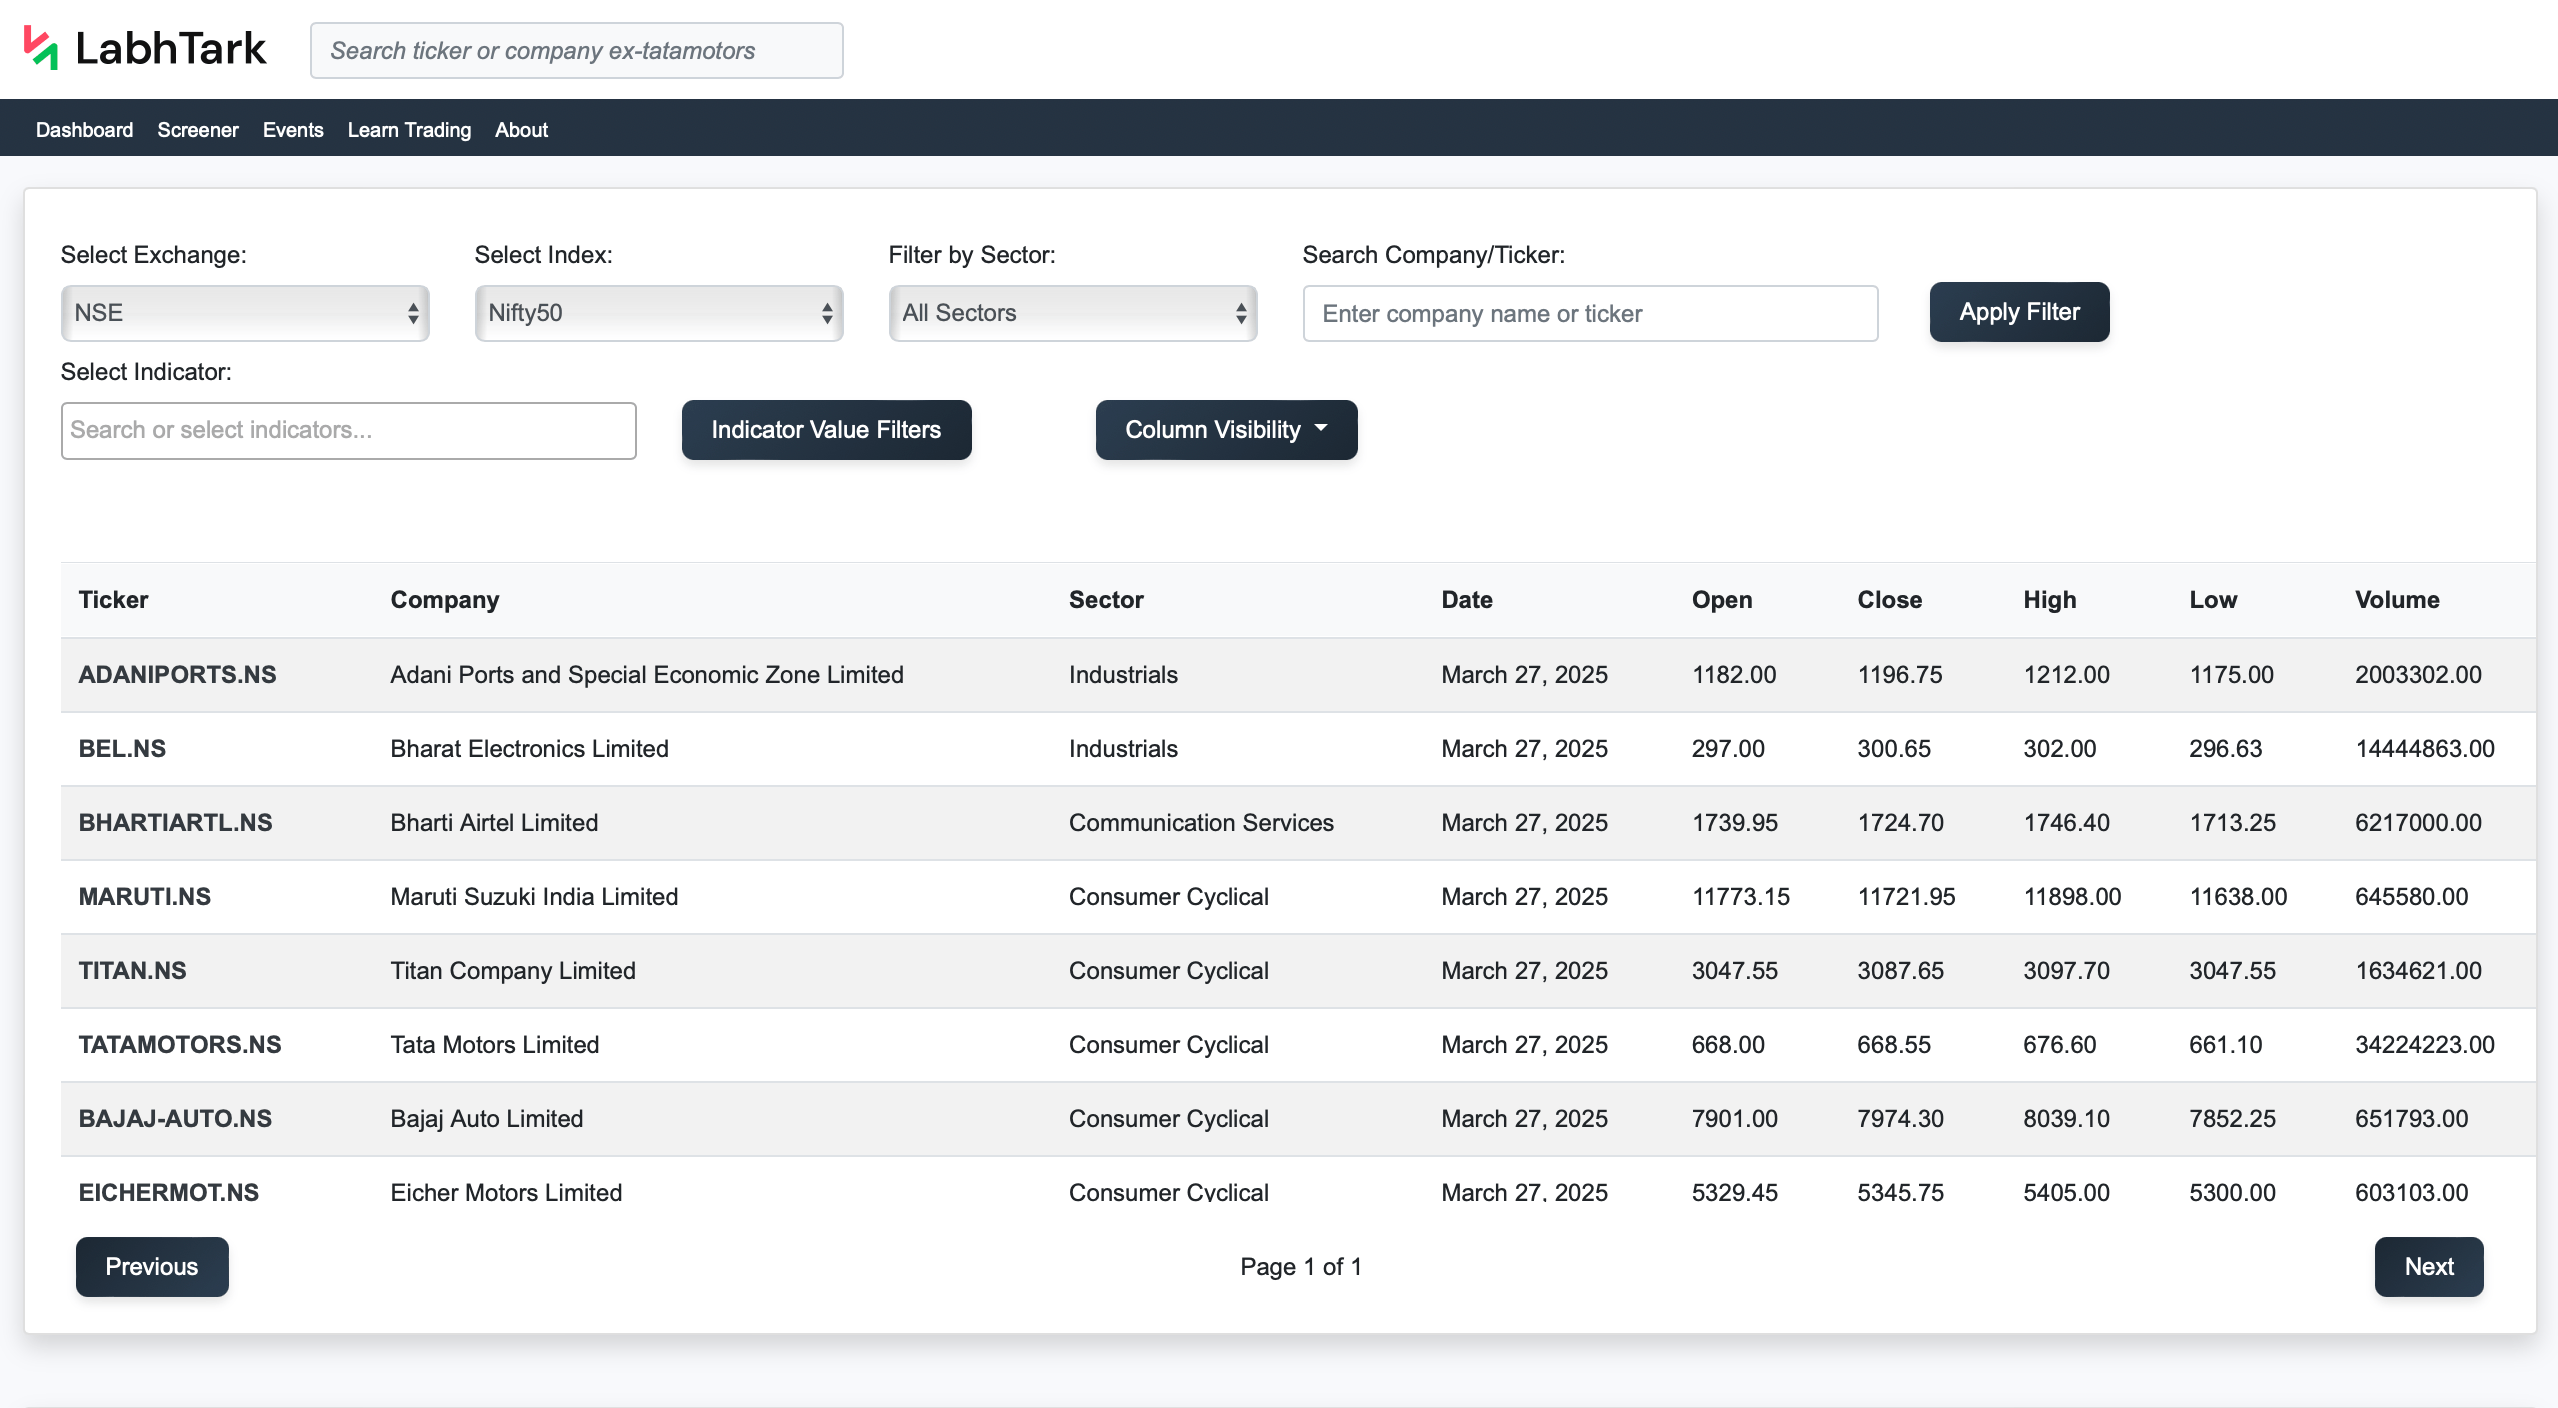
1. Users can select between the stock markets, which are NSE (National Stock Exchange) or BSE (Bombay Stock Exchange) or both, click on “Stock Exchange” dropdown and select the market.
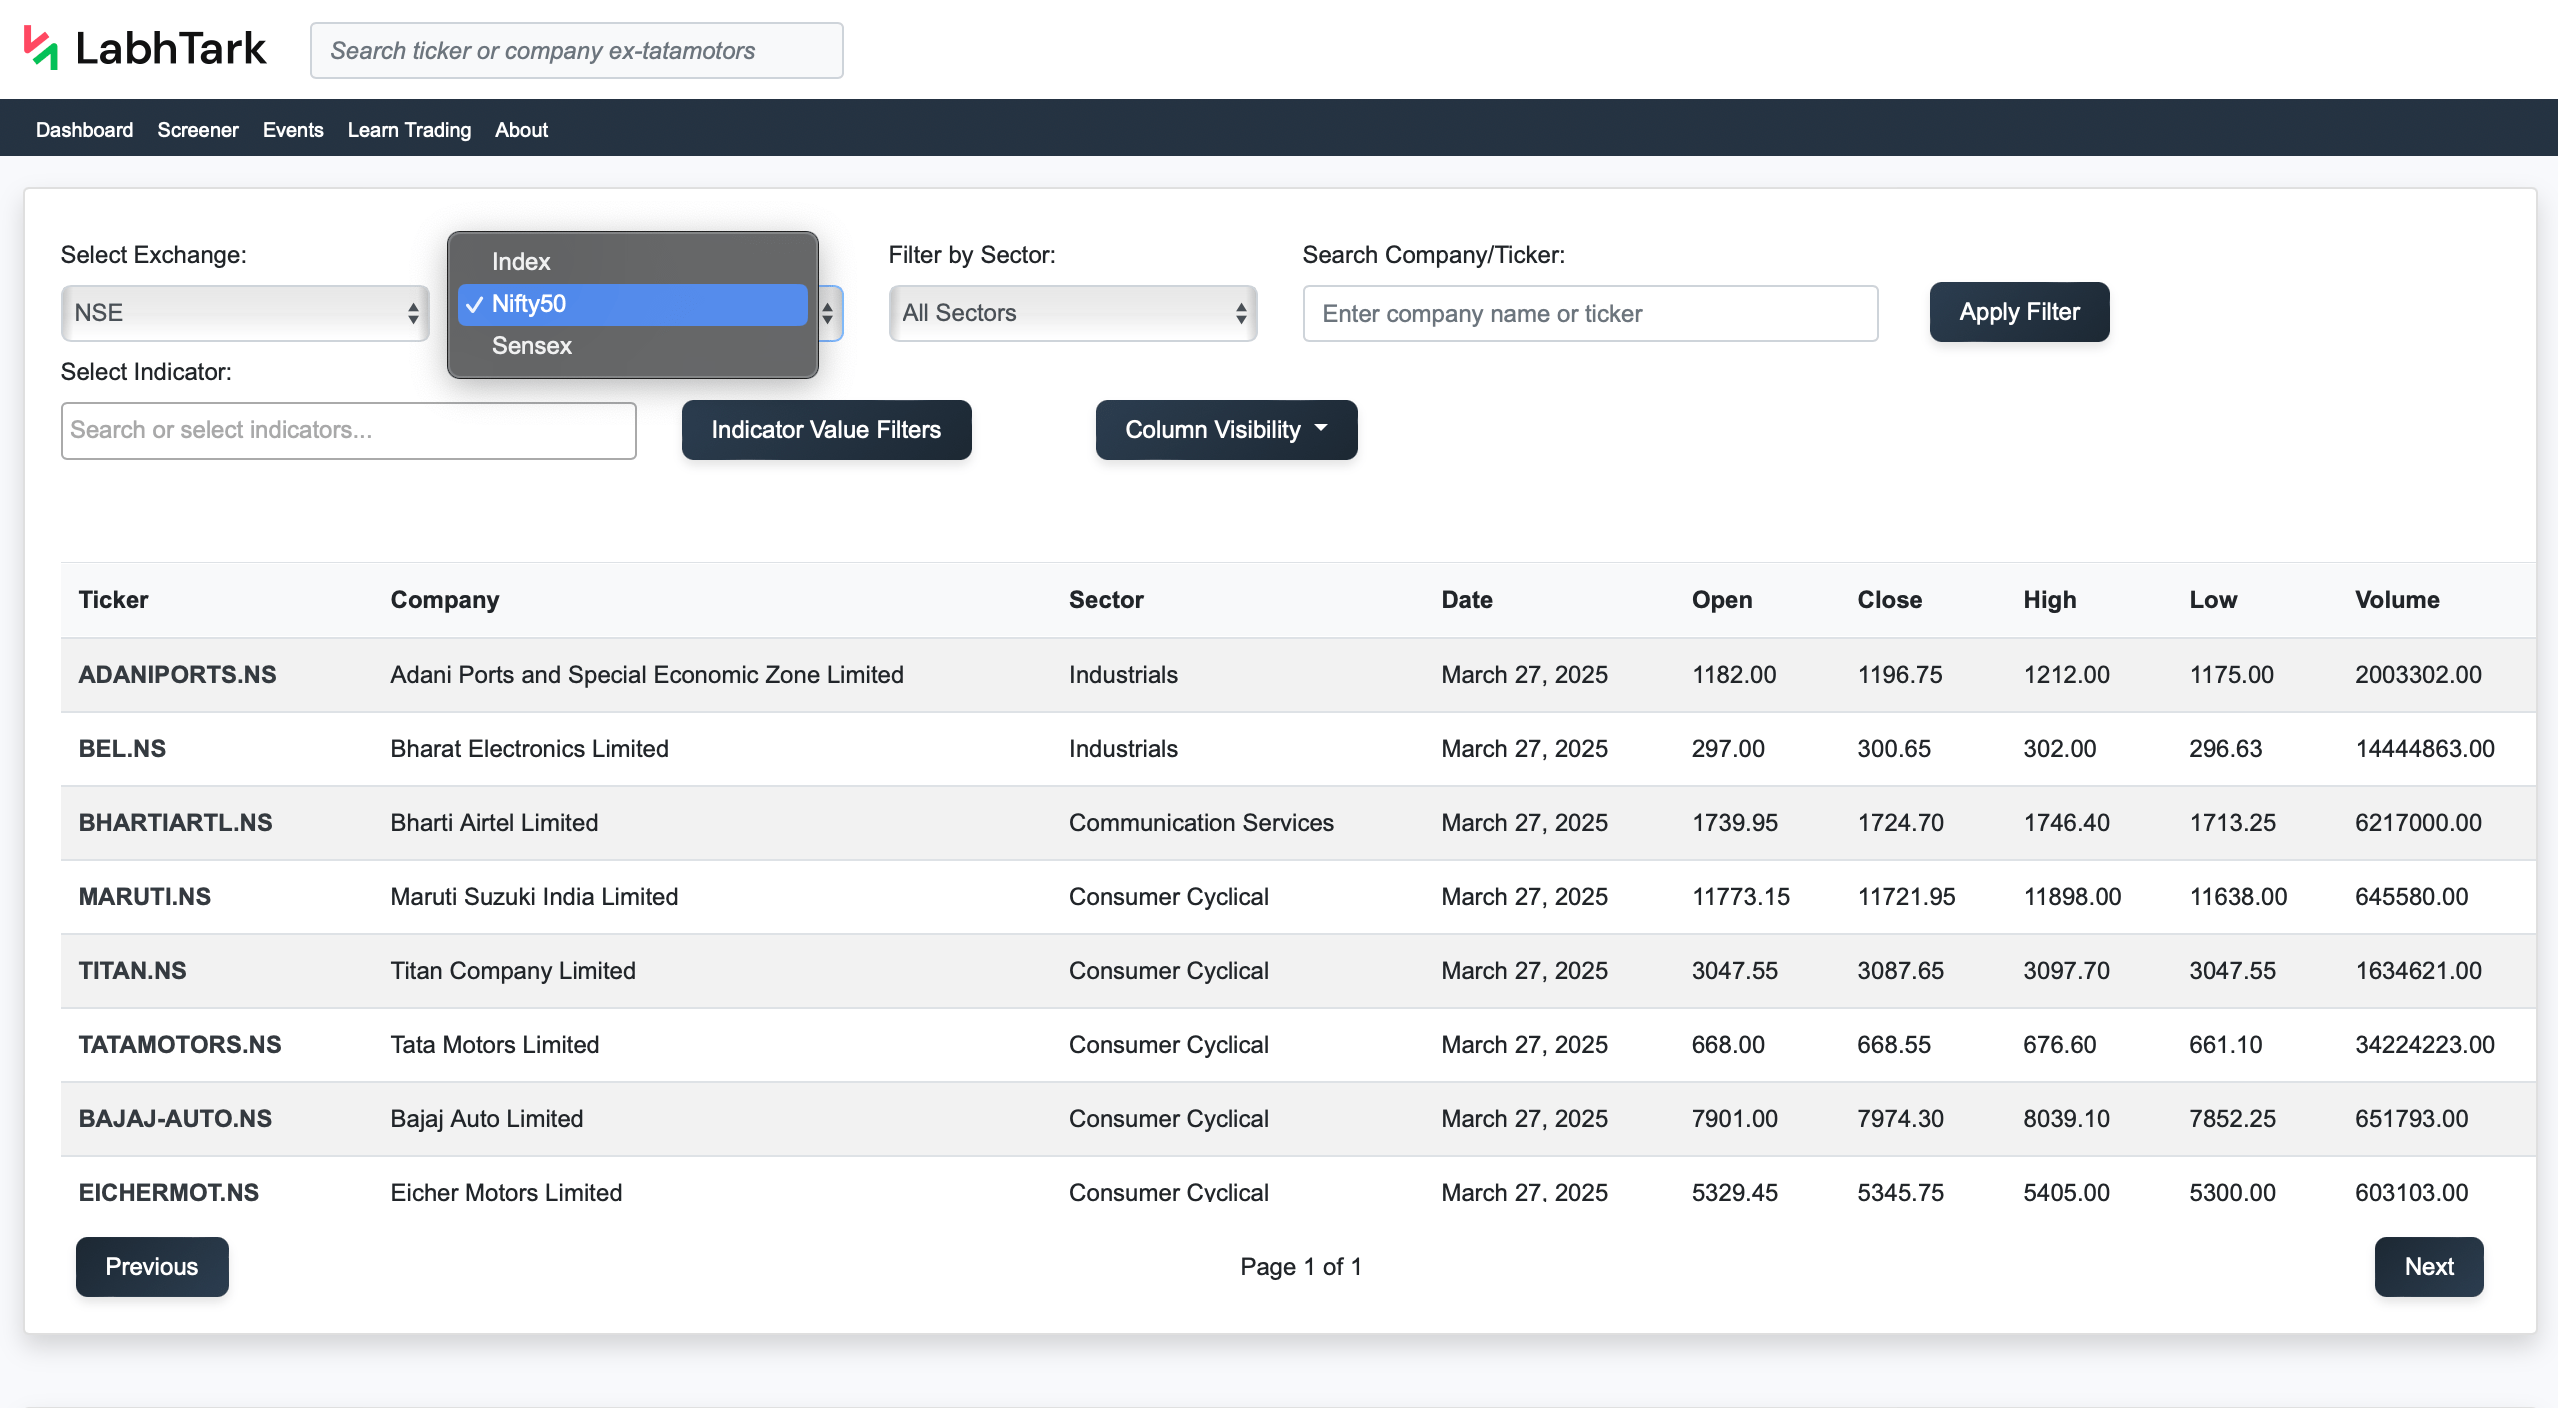
2. Users can select a filter for stocks that are under a specific index like Nifty 50 or Sensex; this will help traders to understand which stocks directly affect the market. Click on the “Select Index” dropdown and select index.
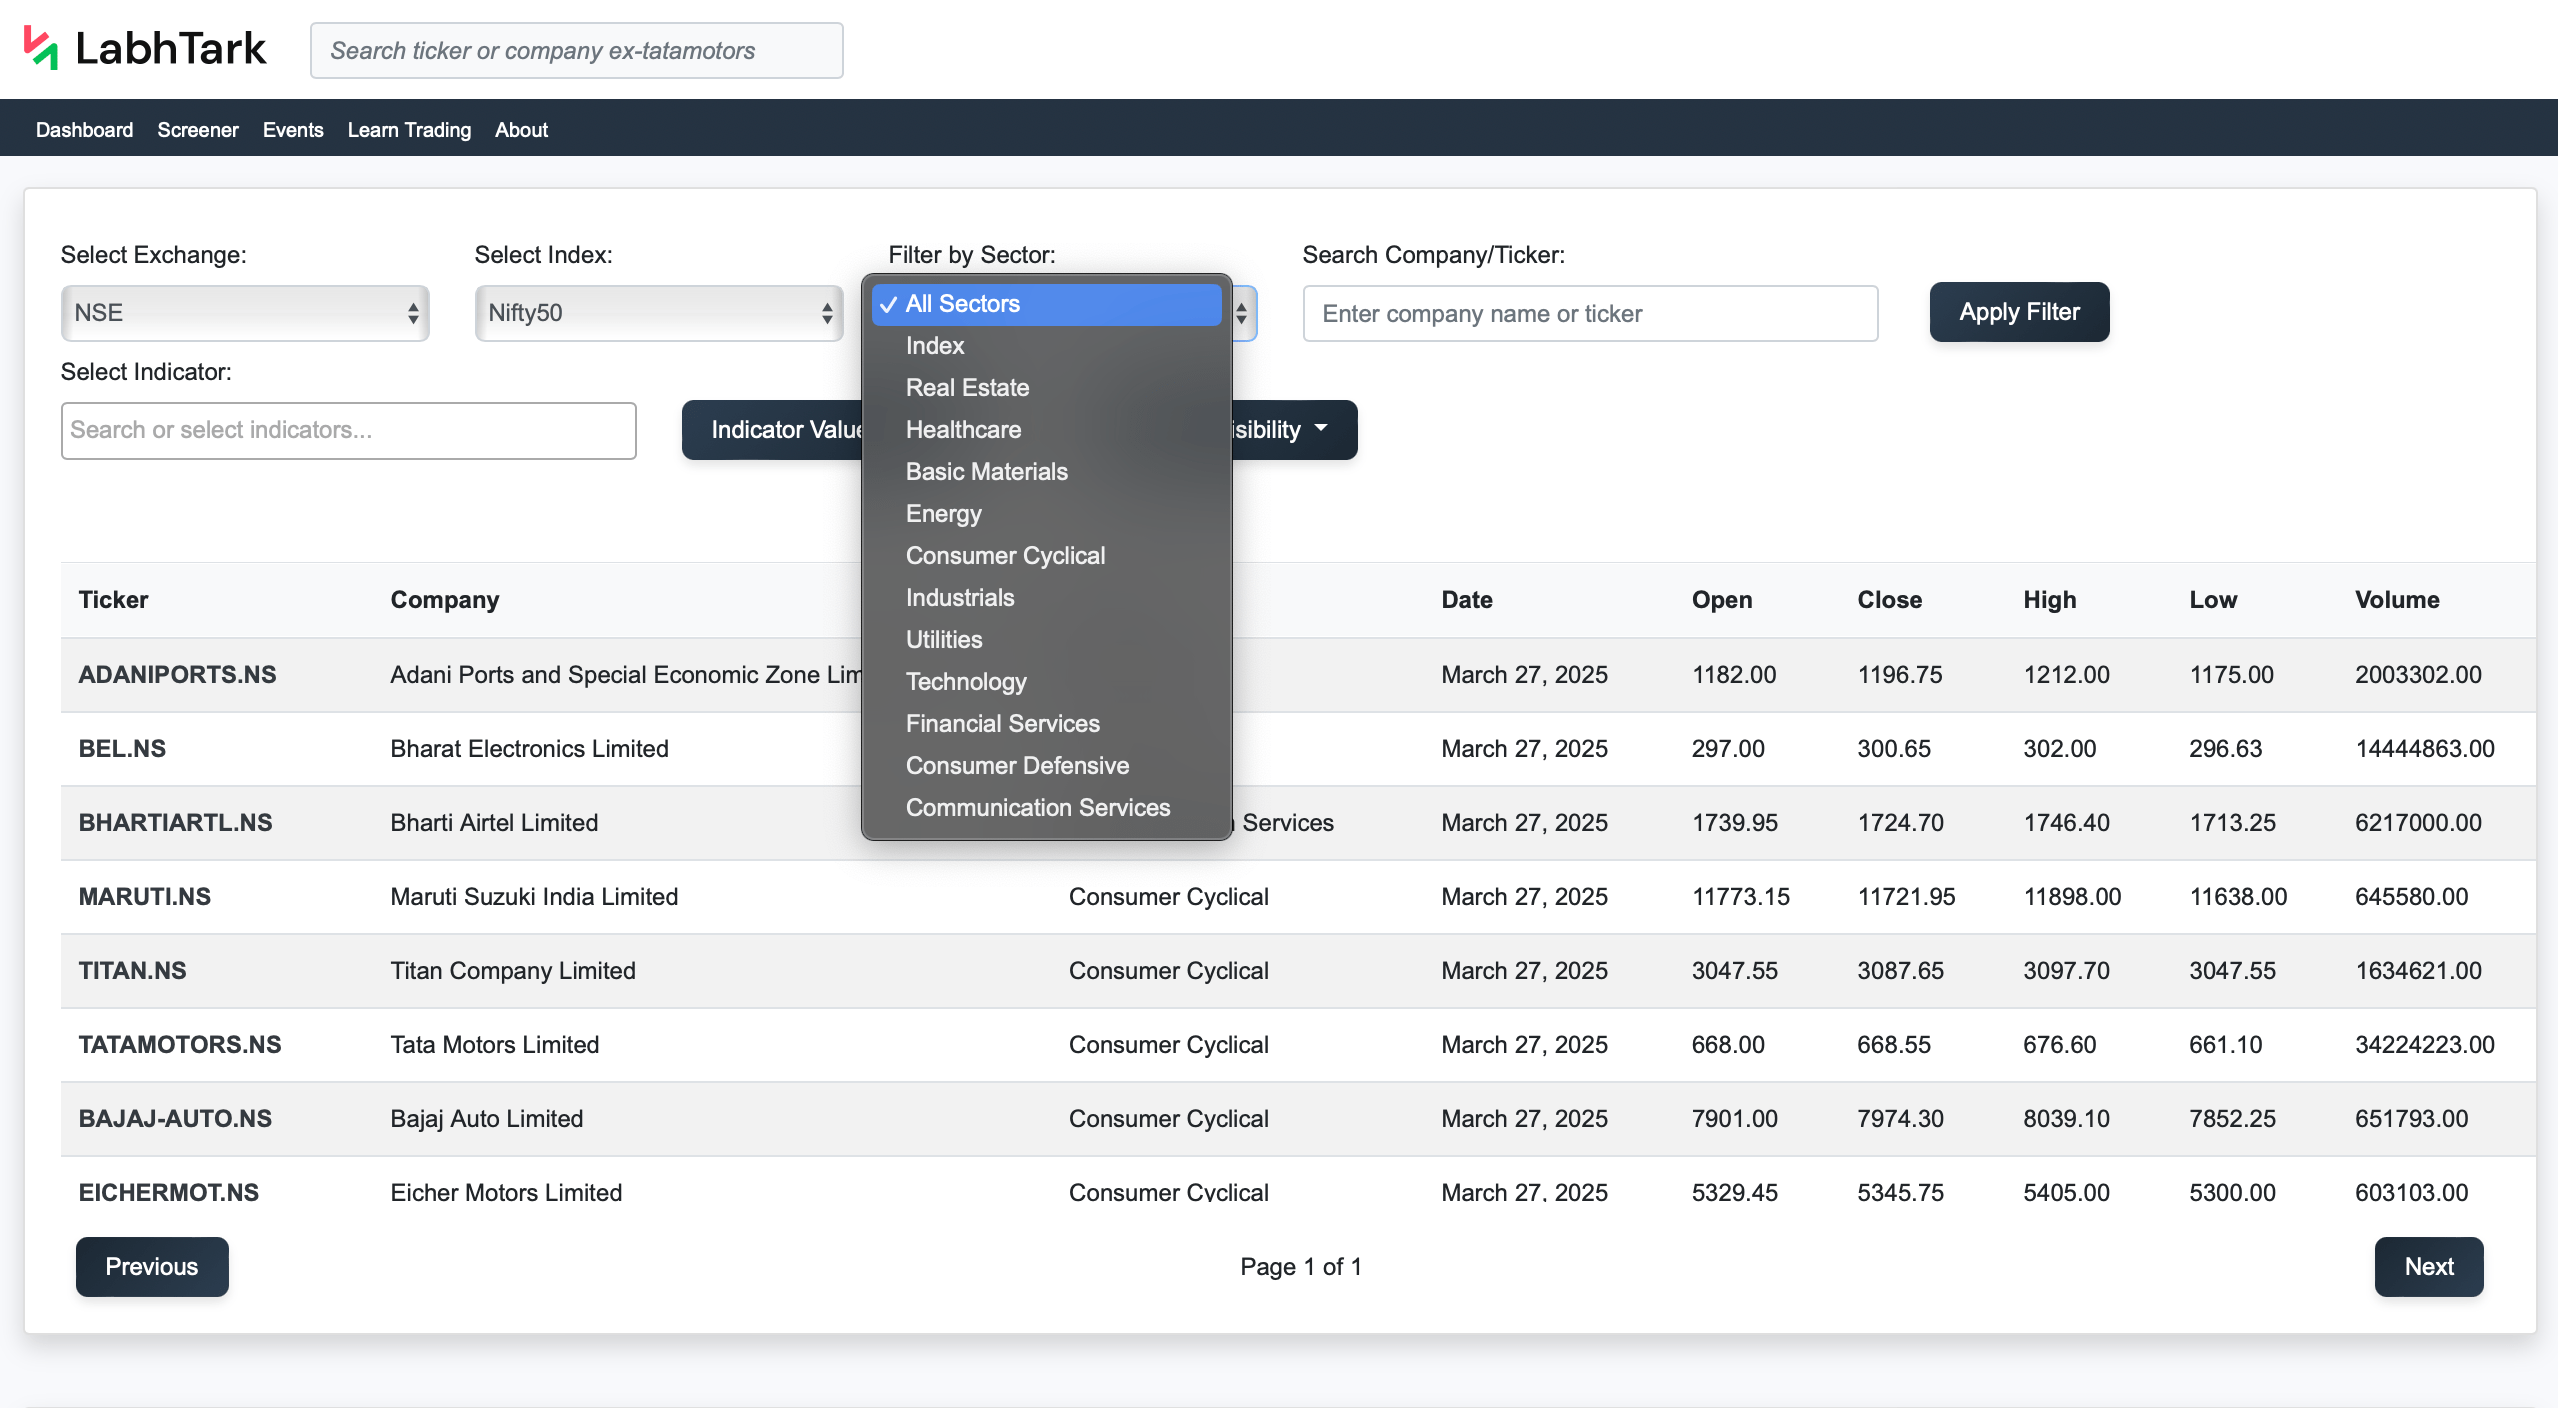
3. Users can filter stocks by sector so that investors can filter the stock from a specific sector and then apply further filters to it; click on “Filter by Sector” and select desired sectors.
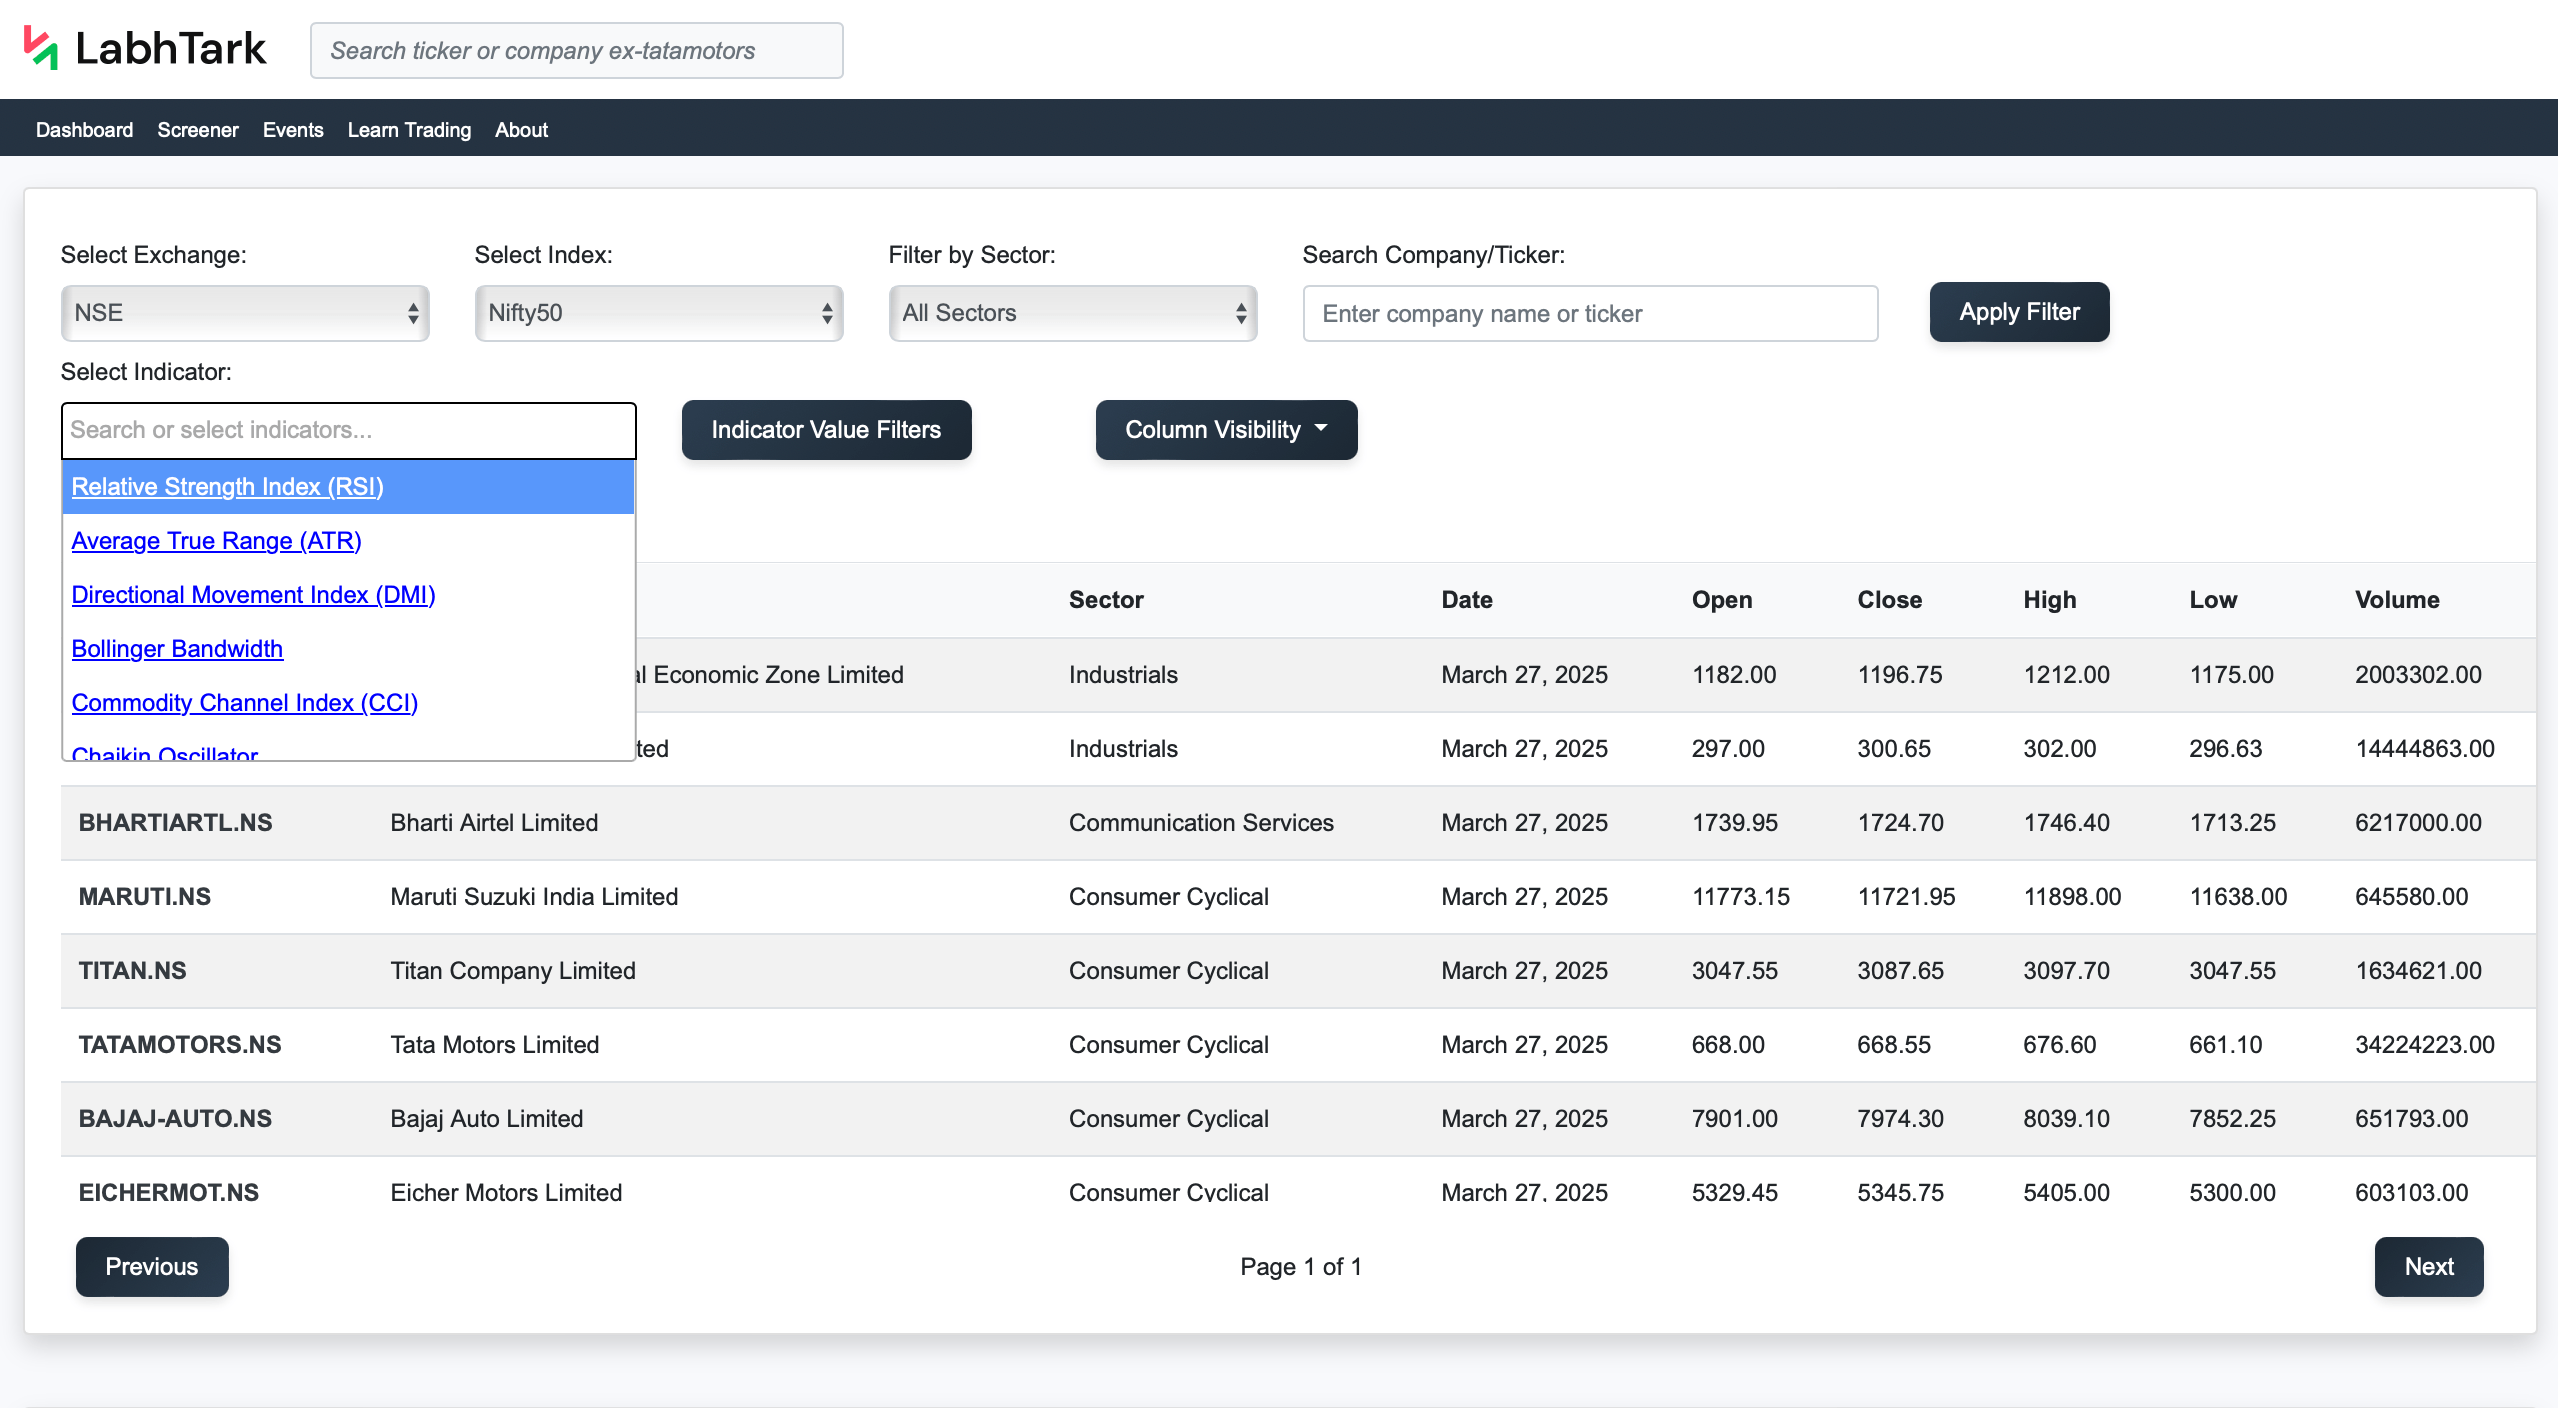
4. In the stock market, we have technical indicators like RSI, ATR, and many others, and we have around 50 technical indicators where traders can select multiple indicators and apply filters on those to get the best stocks to buy according to technical analysis. Click on “Indicators,” select desired technical indicators, and apply filters accordingly.
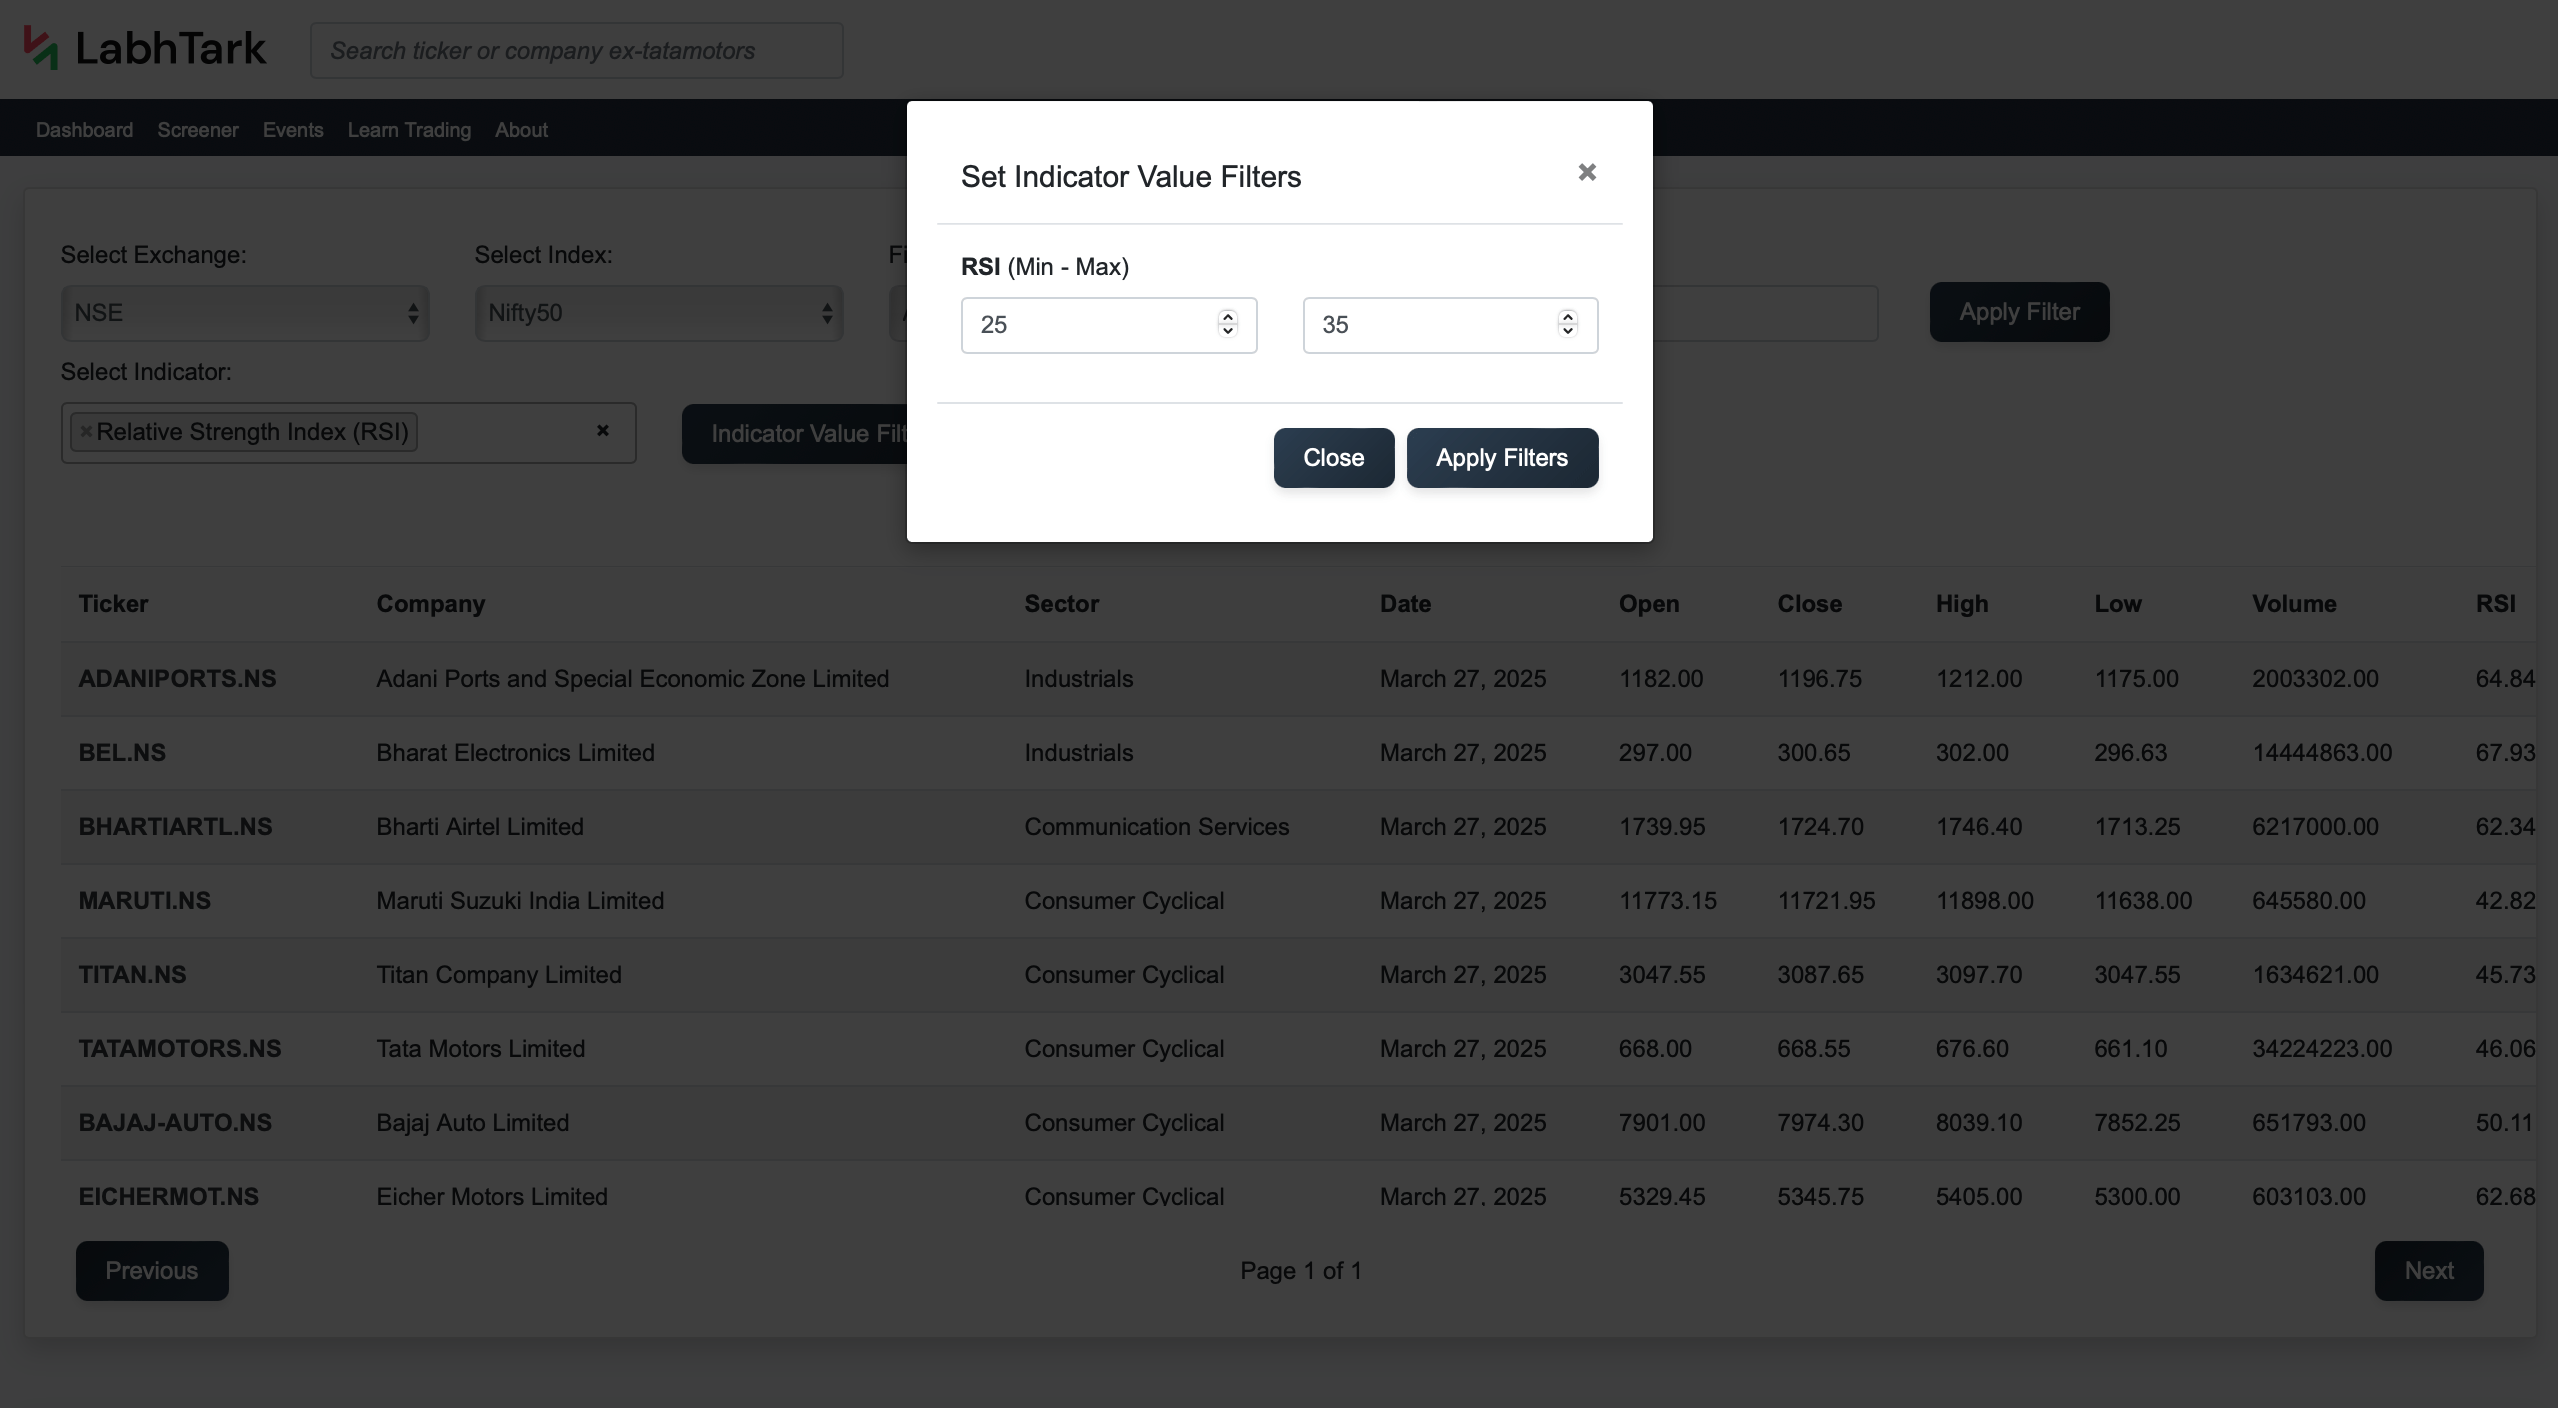
5. Once all the filters are selected, click on the “Apply Filter” button to get the filtered list of stocks.
Why use a screener?
An investor or trader may have different trading strategies; they can be for short-term or long-term, but for both they use indicators, which can be either technical or fundamental.
For any indicator, its value represents some analysis about the stock; for example, if a stock’s RSI is above 70, it is overpriced, or if we take the example of PE ratio and its value between 20 and 30, then it is fairly priced.
But we have more than 5000 stocks listed in the stock market, so it is next to impossible to check each stock and its indicator values, which is why we need a robust screener that can filter stock according to the investor’s strategy.
Popular Stock Screener Filters.
Technical Indicators for Short Term
Undervalued Stock
- RSI (Relative Strength Index): More than 20 and less than 35
- Commodity Channel Index (CCI): less than -100
- TRIX (Triple Exponential Average): less than 0
Overvalued Stock
- RSI (Relative Strength Index): More than 70
- Commodity Channel Index (CCI): More than 100
- TRIX (Triple Exponential Average): more than 0
Fundamental mainly for long-term investors
Undervalued stock with good fundamentals
- Net Profit Margin: Greater than 0.05
- Acid Test Ratio: Greater than 2
- Inventory turnover: Greater than 12
- Debt-to-equity ratio: Less than 0.5
- PE ratio: Between 10 and 20
Overvalued stock with bad fundamentals
- Net Profit Margin: Less than 0.25
- Acid Test Ratio: Less than 0.25
- Inventory turnover: Less than 3
- Debt-to-equity ratio: Greater than 3
- PE ratio: Greater than 100