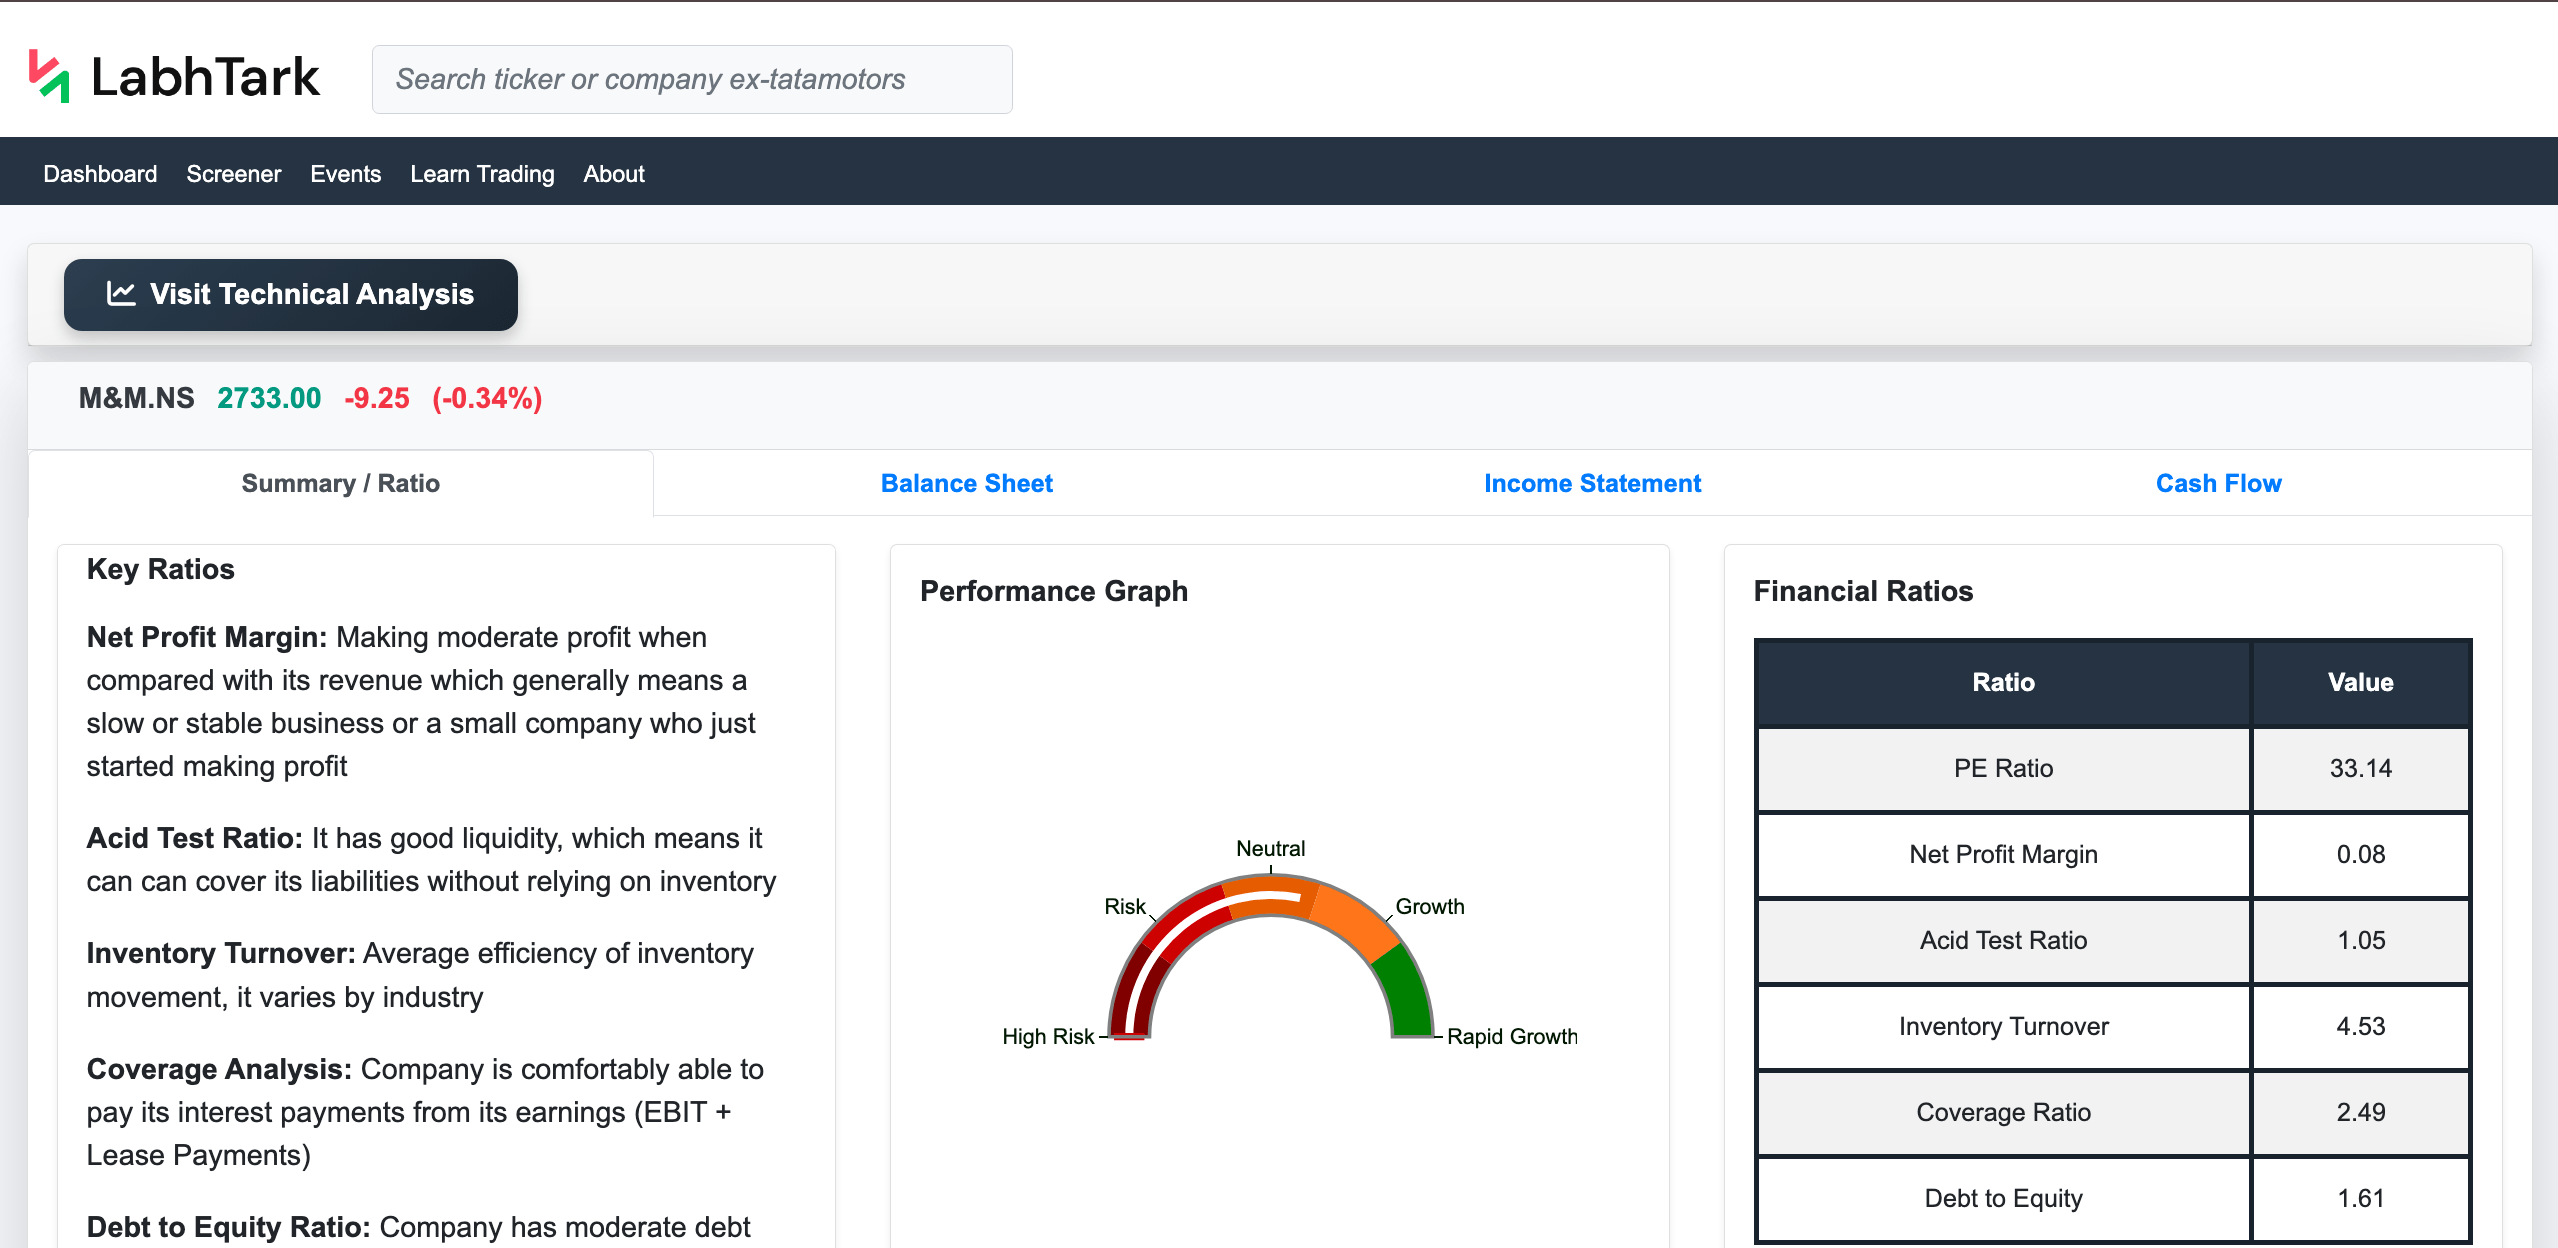
Key Ratios
Net Profit Margin: Making high profit when compared with its revenue which generally means company’s strong hold in the market, and good efficiency of the business
Acid Test Ratio: It has very strong liquidity, which means it can can cover its liabilities without relying on inventory
Inventory Turnover: Average efficiency of inventory movement, it varies by industry
Coverage Analysis: At a very strong financial position where company is easily able to pay its interest payments from its earnings (EBIT + Lease Payments)
Debt to Equity Ratio: NA
P/E Ratio: A little overvalued stock but represent growth stock and possibility of future growth
Performance Graph
Financial Ratios
| Ratio | Value |
|---|---|
| PE Ratio | 30.83 |
| Net Profit Margin | 0.15 |
| Acid Test Ratio | 5.61 |
| Inventory Turnover | 3.36 |
| Coverage Ratio | 252.88 |
| Debt to Equity | 0.00 |
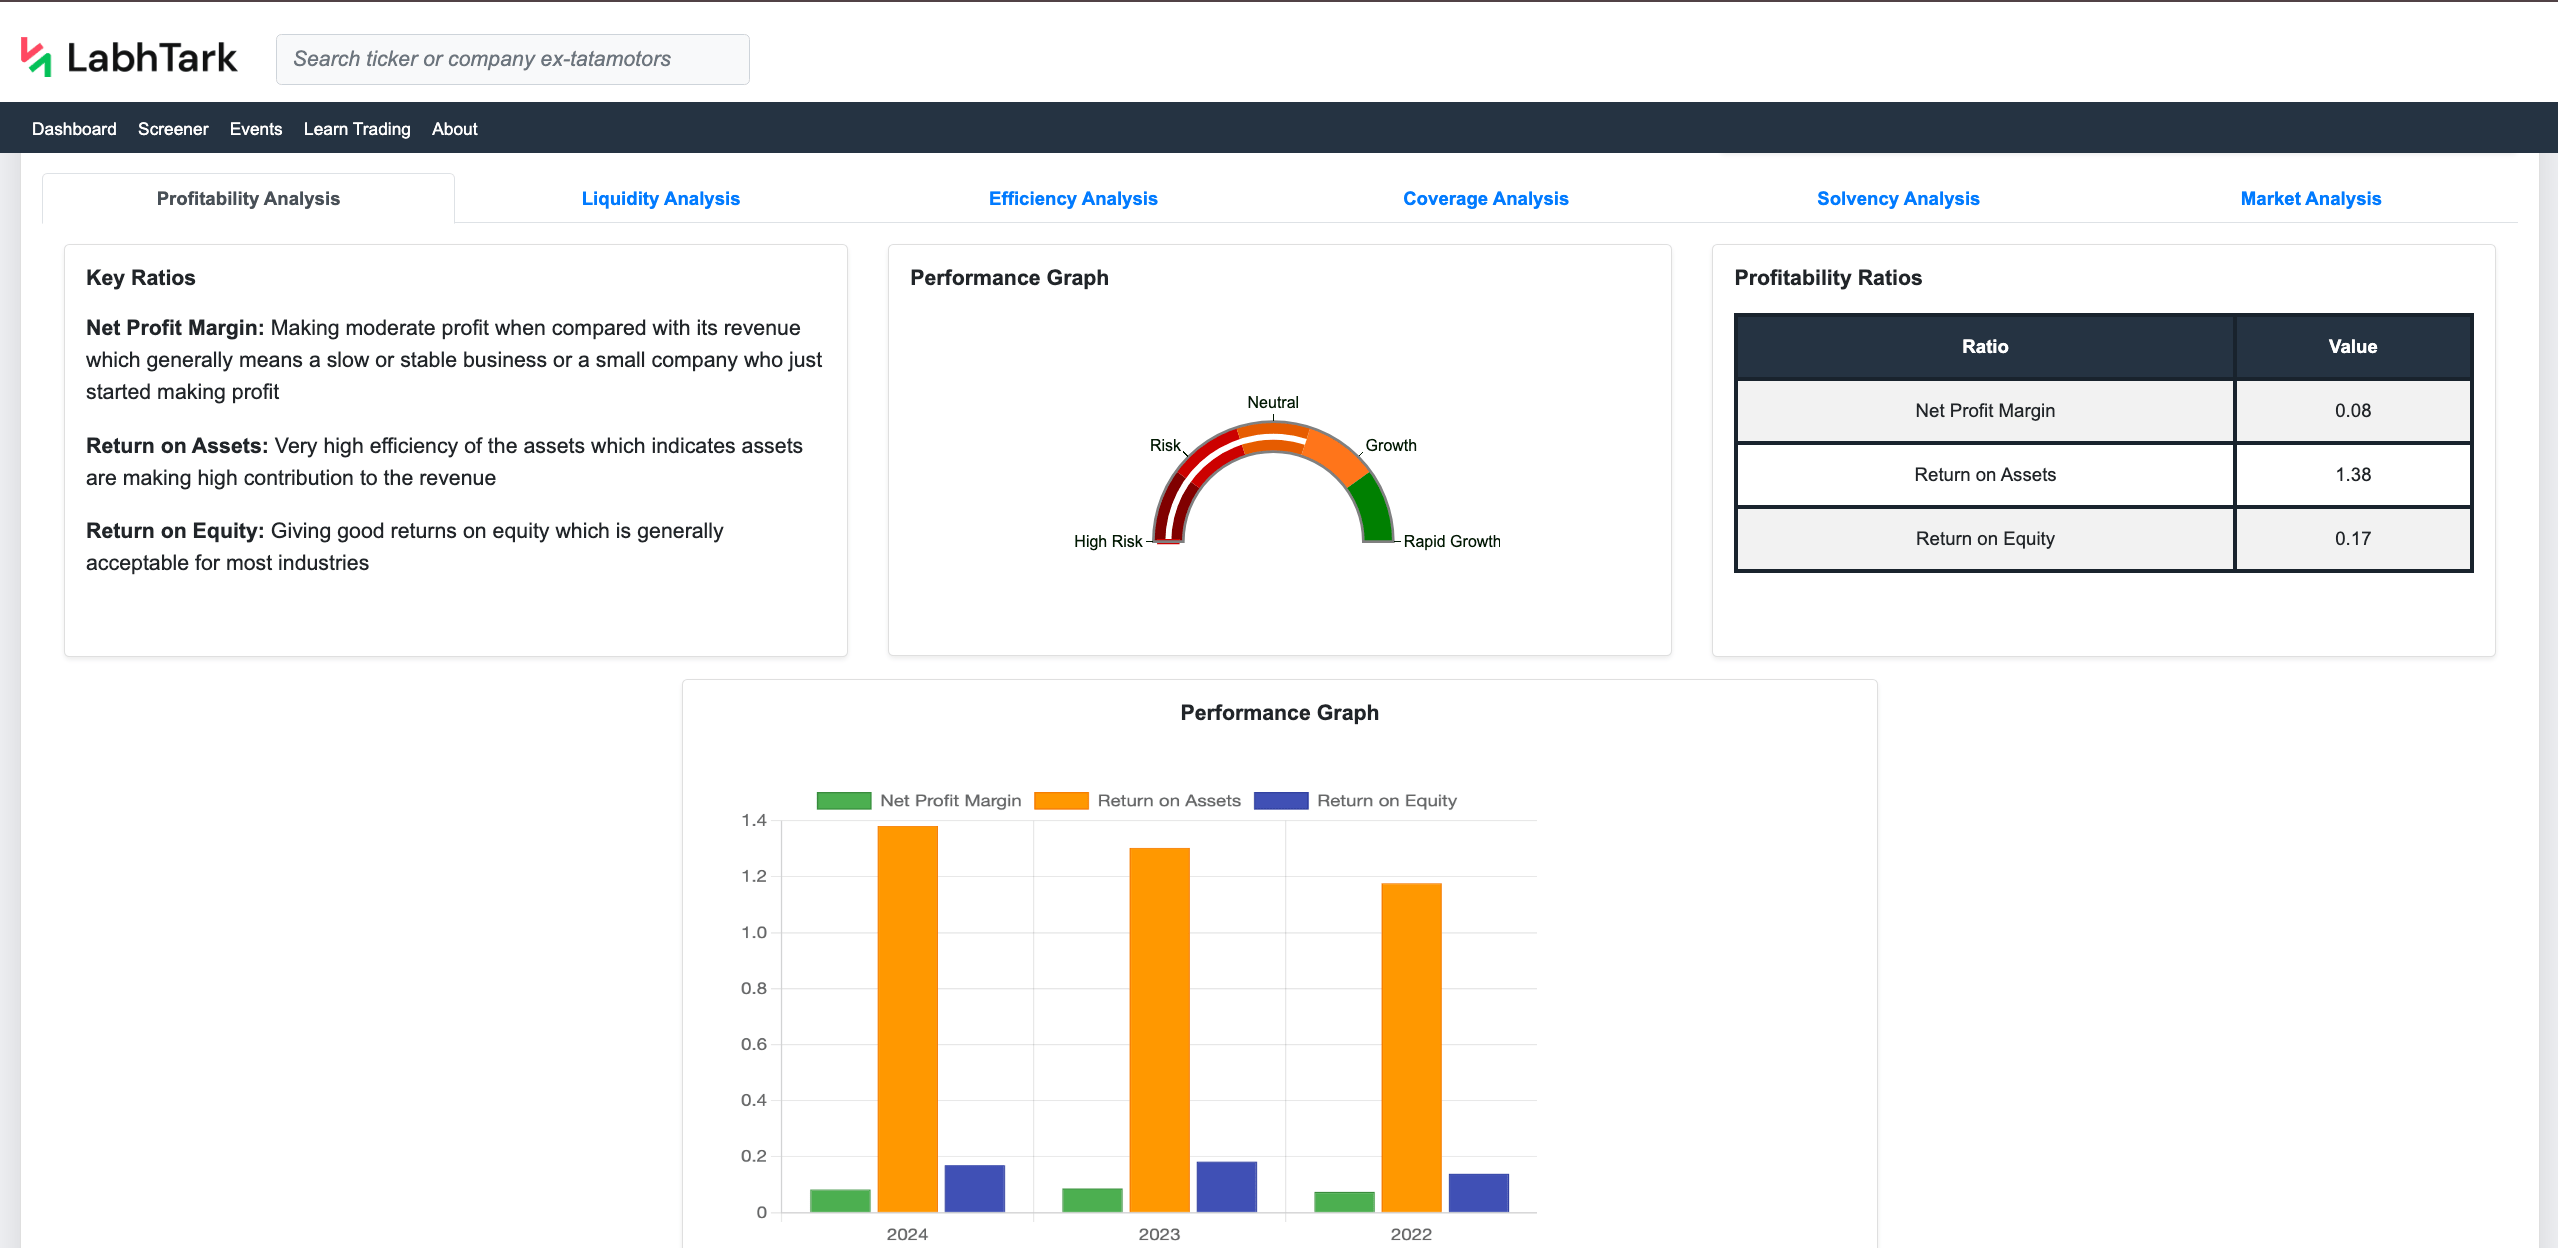
Key Ratios
Net Profit Margin: Making high profit when compared with its revenue which generally means company’s strong hold in the market, and good efficiency of the business
Return on Assets: Very high efficiency of the assets which indicates assets are making high contribution to the revenue
Return on Equity: Giving good returns on equity which is generally acceptable for most industries
Performance Graph
Profitability Ratios
| Ratio | Value |
|---|---|
| Net Profit Margin | 0.15 |
| Return on Assets | 1.37 |
| Return on Equity | 0.10 |
Performance Graph
Key Ratios
Acid Test Ratio: It has very strong liquidity, which means it can can cover its liabilities without relying on inventory
Current Ratio: It has excess cash even after covering its short-term liabilities, which also may indicates mismanagement os assets in some cases
Performance Graph
Liquidity Ratios
| Ratio | Value |
|---|---|
| Acid Test Ratio | 5.61 |
| Current Ratio | 7.29 |
Performance Graph
Key Ratios
Inventory Turnover: Average efficiency of inventory movement, it varies by industry
Performance Graph
Efficiency Ratios
| Ratio | Value |
|---|---|
| Inventory Turnover | 3.36 |
Performance Graph
Key Ratios
Coverage Analysis: At a very strong financial position where company is easily able to pay its interest payments from its earnings (EBIT + Lease Payments)
Performance Graph
Coverage Ratios
| Ratio | Value |
|---|---|
| Coverage Ratio | 252.88 |
Performance Graph
Key Ratios
Debt to Equity Ratio: NA
Interest Coverage Ratio: Company is at low risk of getting default as it can easily cover its interest payments and strong financial health
Performance Graph
Solvency Ratios
| Ratio | Value |
|---|---|
| Debt to Equity Ratio | 0.00 |
| Interest Coverage Ratio | 252.88 |
Performance Graph
Key Ratios
P/E Ratio: A little overvalued stock but represent growth stock and possibility of future growth
Dividend Yield: Low yield, focus on growth rather than dividends (Low dividend yield, which means company is focusing on growth
Performance Graph
Market Ratios
| Ratio | Value |
|---|---|
| P/E Ratio | 30.83 |
| Gross Profit Margin | 0.43 |
| Price to Book Ratio | 3.22 |
| Dividend Yield | 0.00 |
Performance Graph
Balance Sheet Analysis of Diamines and Chemicals Limited
The balance sheet in the financial statement of the company shows its financial position at a particular point in time.
It consists of the following:
- Assets: Something that the company owns and that gives financial benefits over a period of time.
- Liabilities: Something that a company owes and that has a financial burden on the company.
- Equity: It is basically the owner’s share in the company.
The formula is:
Assets = Liabilities + Equity📌Assets:
Asset |
Value & Year |
||
|---|---|---|---|
2024 |
2023 |
2022 |
|
| Total Assets | 1626757000 | 1510765000 | 1105496000 |
| Total Non Current Assets | 876016000 | 823080000 | 565023000 |
| Other Non Current Assets | 1000 | 2000 | -2000 |
| Non Current Prepaid Assets | 28082000 | 26130000 | 25775000 |
| Non Current Deferred Taxes Assets | - | - | - |
| Financial Assets | - | - | - |
| Investment In Financial Assets | 144316000 | 133028000 | 126673000 |
| Held To Maturity Securities | - | - | - |
| Available For Sale Securities | 144316000 | 133028000 | 126673000 |
| Financial Assets Fair Value | - | - | - |
| Long Term Equity Investment | 13331000 | - | 9000 |
| Investments In Associates At Cost | 13331000 | - | 9000 |
| Goodwill And Other Intangible Assets | 863000 | 97000 | 201000 |
| Other Intangible Assets | 863000 | 97000 | 201000 |
| Goodwill | - | - | - |
| Net Ppe | 661436000 | 621567000 | 407367000 |
| Accumulated Depreciation | -185489000 | -152258000 | -135440000 |
| Gross Ppe | 846925000 | 773825000 | 542807000 |
| Construction In Progress | 8485000 | 221023000 | 32064000 |
| Other Properties | 43891000 | 36946000 | 32804000 |
| Machinery Furniture Equipment | 528985000 | 262542000 | 234724000 |
| Buildings And Improvements | 117987000 | 106694000 | 103552000 |
| Land And Improvements | 147577000 | 146620000 | 139663000 |
| Properties | - | - | - |
| Current Assets | 750741000 | 687685000 | 540473000 |
| Other Current Assets | 15924000 | -1000 | 7860000 |
| Hedging Assets Current | - | - | - |
| Assets Held For Sale Current | - | - | - |
| Restricted Cash | 25604000 | 14813000 | 10512000 |
| Prepaid Assets | 27136000 | 19867000 | 12406000 |
| Inventory | 173578000 | 168347000 | 22972000 |
| Other Inventories | 2961000 | 1939000 | 4315000 |
| Finished Goods | 63945000 | 32958000 | 11051000 |
| Work In Process | 23389000 | 36105000 | 3481000 |
| Raw Materials | 83283000 | 97345000 | 4125000 |
| Other Receivables | 10635000 | 7032000 | 9456000 |
| Taxes Receivable | 4055000 | 666000 | 179000 |
| Accounts Receivable | 166959000 | 228913000 | 100161000 |
| Allowance For Doubtful Accounts Receivable | - | - | - |
| Gross Accounts Receivable | 166959000 | 228913000 | 100161000 |
| Cash Cash Equivalents And Short Term Investments | 342774000 | 248048000 | 384787000 |
| Other Short Term Investments | 337500000 | 231631000 | 380869000 |
| Cash And Cash Equivalents | 5274000 | 16417000 | 3918000 |
| Cash Equivalents | - | - | - |
| Cash Financial | 5274000 | 16417000 | 3918000 |
📌 Liabilities & Equity
Liability/Equity |
Value & Year |
||
|---|---|---|---|
2024 |
2023 |
2022 |
|
| Net Debt | - | - | - |
| Total Debt | - | - | - |
| Total Liabilities Net Minority Interest | 145615000 | 165510000 | 103559000 |
| Total Non Current Liabilities Net Minority Interest | 42683000 | 39064000 | 39454000 |
| Other Non Current Liabilities | 1000 | -1000 | - |
| Derivative Product Liabilities | - | - | - |
| Non Current Pension And Other Postretirement Benefit Plans | 2548000 | 2534000 | 4019000 |
| Trade And Other Payables Non Current | - | 2237000 | - |
| Non Current Deferred Revenue | - | - | - |
| Non Current Deferred Taxes Liabilities | 40135000 | 34294000 | 35435000 |
| Long Term Debt And Capital Lease Obligation | - | - | - |
| Long Term Capital Lease Obligation | - | - | - |
| Long Term Debt | - | - | - |
| Long Term Provisions | 2548000 | 4771000 | 4019000 |
| Current Liabilities | 102932000 | 126446000 | 64105000 |
| Other Current Liabilities | 13621000 | 9410000 | 12416000 |
| Current Deferred Taxes Liabilities | - | - | - |
| Current Debt And Capital Lease Obligation | - | - | - |
| Current Capital Lease Obligation | - | - | - |
| Current Debt | - | - | - |
| Pension And Other Post Retirement Benefit Plans Current | - | - | - |
| Current Provisions | 2144000 | 3584000 | 3240000 |
| Payables | 75700000 | 103490000 | 41237000 |
| Other Payable | 18326000 | 22758000 | 13027000 |
| Dividends Payable | 5431000 | 5125000 | 4370000 |
| Total Tax Payable | - | - | - |
| Accounts Payable | 51943000 | 75607000 | 23840000 |
| Common Stock Equity | 1481142000 | 1345255000 | 1001937000 |
| Total Capitalization | 1481142000 | 1345255000 | 1001937000 |
| Total Equity Gross Minority Interest | 1481142000 | 1345255000 | 1001937000 |
| Minority Interest | - | - | - |
| Stockholders Equity | 1481142000 | 1345255000 | 1001937000 |
| Other Equity Interest | 276000 | 742000 | 904105000 |
| Treasury Stock | - | - | - |
| Retained Earnings | 1281080000 | 1154931000 | 794245000 |
| Additional Paid In Capital | - | - | - |
| Capital Stock | 97840000 | 97832000 | 97832000 |
| Common Stock | 97840000 | 97832000 | 97832000 |
Income statement interpretation for Diamines and Chemicals Limited
The income statement in the financial statement of the company shows its company financial performance over a period in time.
It consists of the following:
- Revenue: It is the total amount of money earned from the core business activity of the company.
- Expenses: It is the total amount required for running the full functionality of the company.
- Profit or loss:In very simple terms, when a company pays its expenses using its revenue, then what’s left is profit, and in case expenses are more when compared with revenue, then it is loss.
📌Revenue & Profitability
Revenue/Profitability |
Value & Year |
||
|---|---|---|---|
2024 |
2023 |
2022 |
|
| Total Revenue | 1028273000 | 1103727000 | 658898000 |
| Operating Revenue | 1028273000 | 1103727000 | 658898000 |
| Cost Of Revenue | 584009000 | 365838000 | 283062000 |
| Gross Profit | 444264000 | 737889000 | 375836000 |
| Ebitda | 251300000 | 581539000 | 237950000 |
| Ebit | 222788000 | 563712000 | 221270000 |
| Operating Income | 208192000 | 540871000 | 213323000 |
| Net Income | 154705000 | 419036000 | 167136000 |
| Net Income From Continuing Operation Net Minority Interest | 154705000 | 419036000 | 167136000 |
| Net Income From Continuing And Discontinued Operation | 154705000 | 419036000 | 167136000 |
| Net Income Common Stockholders | 154705000 | 419036000 | 167136000 |
| Net Income Including Noncontrolling Interests | 154705000 | 419036000 | 167136000 |
| Net Income Discontinuous Operations | - | - | - |
| Net Income Continuous Operations | 154705000 | 419036000 | 167136000 |
| Normalized Income | 161080522 | 419750683 | 173836658 |
| Normalized Ebitda | 260205000 | 582500000 | 246809000 |
| Total Unusual Items | -8905000 | -961000 | -8859000 |
| Total Unusual Items Excluding Goodwill | -8905000 | -961000 | -8859000 |
📌Expenses & Taxes
Expenses/Taxes |
Value & Year |
||
|---|---|---|---|
2024 |
2023 |
2022 |
|
| Reconciled Depreciation | 28512000 | 17827000 | 16680000 |
| Reconciled Cost Of Revenue | 584009000 | 365838000 | 283062000 |
| Total Expenses | 820081000 | 562856000 | 445575000 |
| Operating Expense | 236072000 | 197018000 | 162513000 |
| Other Operating Expenses | 45801000 | 49945000 | 33067000 |
| Depreciation And Amortization In Income Statement | 28512000 | 17827000 | 16680000 |
| Amortization | 249000 | 152000 | 152000 |
| Depreciation Income Statement | 28263000 | 17675000 | 16528000 |
| Selling General And Administration | 44038000 | 29668000 | 25549000 |
| Selling And Marketing Expense | 10004000 | 9606000 | 4092000 |
| General And Administrative Expense | 34034000 | 20062000 | 21457000 |
| Rent And Landing Fees | 4159000 | 2021000 | 3264000 |
| Tax Provision | 63033000 | 144433000 | 53836000 |
| Pretax Income | 221907000 | 563504000 | 220972000 |
| Other Non Operating Income Expenses | 25586000 | 12000 | 5000 |
| Special Income Charges | -8905000 | -961000 | -8859000 |
| Other Special Charges | -859000 | 961000 | 6286000 |
| Write Off | - | - | - |
| Net Non Operating Interest Income Expense | 19615000 | 19109000 | 15418000 |
| Total Other Finance Cost | 1070000 | 1239000 | 557000 |
| Interest Expense Non Operating | 881000 | 208000 | 298000 |
| Interest Income Non Operating | 21566000 | 20556000 | 16273000 |
📌 Earnings Per Share
Earnings Per Share |
Value & Year |
||
|---|---|---|---|
2024 |
2023 |
2022 |
|
| Diluted Eps | 16.23 | 42.80 | 17.08 |
| Basic Eps | 16.24 | 42.84 | 17.08 |
| Diluted Ni Avail To Com Stockholders | 154705000 | 419036000 | 167136000 |
| Net Income From Continuing Operations | 217738000 | 563469000 | 220972000 |
| Minority Interests | - | - | - |
Cash flow analysis for Diamines and Chemicals Limited
The cashflow statement in the financial statement of the company shows how cash is moving in or moving out of the company over a period of time.
It consists of the following:
- Operating activities: Cash flow from the core business operations.
- Investing activities: Cashflow from investments made by the company.
- Financing activities: These are cash from loans or by issuing shares or paying out dividends.
📌Operating Cash Flow
Operating Cash Flow |
Value & Year |
||
|---|---|---|---|
2024 |
2023 |
2022 |
|
| Operating Cash Flow | 218962000 | 162846000 | 272739000 |
| Changes In Cash | -659000 | 16072000 | 5036000 |
| Taxes Refund Paid | -65645000 | -146440000 | -62102000 |
| Change In Working Capital | 45683000 | -251311000 | 105344000 |
| Change In Other Current Liabilities | -2073000 | 11324000 | 13911000 |
| Change In Other Current Assets | -3435000 | -4501000 | 2566000 |
| Change In Payable | -24752000 | 52738000 | -4813000 |
| Change In Inventory | -5231000 | -145307000 | 102444000 |
| Change In Receivables | 81174000 | -165565000 | -8764000 |
| Other Non Cash Items | -19002000 | -19109000 | -15418000 |
| Stock Based Compensation | - | - | - |
| Provision And Write Off Of Assets | -158000 | -18000 | -775000 |
| Depreciation And Amortization | 28512000 | 17827000 | 16680000 |
| Amortization Cash Flow | 249000 | 152000 | 152000 |
| Depreciation | 28263000 | 17675000 | 16528000 |
📌Investing Cash Flow
Investing Cash Flow |
Value & Year |
||
|---|---|---|---|
2024 |
2023 |
2022 |
|
| Investing Cash Flow | -188328000 | -86628000 | -214908000 |
| Net Other Investing Changes | - | 150935000 | -73604000 |
| Interest Received Cfi | 21566000 | 20556000 | 16273000 |
| Dividends Received Cfi | 2312000 | 1599000 | 810000 |
| Net Investment Purchase And Sale | -109778000 | 150935000 | -73607000 |
| Sale Of Investment | - | 151810000 | 1416000 |
| Purchase Of Investment | -127243000 | -27707000 | -32509000 |
| Net Business Purchase And Sale | -17465000 | -26832000 | -31093000 |
| Sale Of Business | - | 875000 | 1416000 |
| Purchase Of Business | -17465000 | -27707000 | -32509000 |
| Net Ppe Purchase And Sale | -84963000 | -232886000 | -127291000 |
| Sale Of Ppe | 1120000 | 17000 | 22421000 |
| Purchase Of Ppe | -86083000 | -232903000 | -149712000 |
| Net Intangibles Purchase And Sale | - | - | - |
| Purchase Of Intangibles | - | - | - |
📌 Financing Cash Flow
Financing Cash Flow |
Value & Year |
||
|---|---|---|---|
2024 |
2023 |
2022 |
|
| Financing Cash Flow | -31293000 | -60146000 | -52795000 |
| Net Other Financing Charges | - | -30100 | - |
| Interest Paid Cff | -1951000 | -1447000 | -855000 |
| Cash Dividends Paid | -29350000 | -58699000 | -48916000 |
| Common Stock Dividend Paid | -29350000 | -58699000 | -48916000 |
| Net Common Stock Issuance | 8000 | - | - |
| Common Stock Payments | - | - | - |
| Common Stock Issuance | 8000 | - | - |
| Repurchase Of Capital Stock | - | - | - |
| Repayment Of Debt | - | - | - |
| Issuance Of Debt | - | - | - |
| Issuance Of Capital Stock | 8000 | - | - |
| Net Issuance Payments Of Debt | - | - | -3024000 |
| Net Short Term Debt Issuance | - | - | -3024000 |
| Short Term Debt Issuance | - | - | - |
| Net Long Term Debt Issuance | - | - | - |
| Long Term Debt Payments | - | - | - |
| Long Term Debt Issuance | - | - | - |
| Net Preferred Stock Issuance | - | - | - |
| Preferred Stock Payments | - | - | - |
Summary
Fundamental Overview of DIAMINESQ.NS (Diamines and Chemicals Limited)
Above is the summary for fundamental analysis of Diamines and Chemicals Limited , whose ticker name is DIAMINESQ.NS and belongs to sector Basic Materials, and it is listed in NSE (National Stock Exchange).
The Diamines and Chemicals Limited which is listed in NSE (National Stock Exchange) has a PE ratio of 30.83, DIAMINESQ.NS has a net profit margin of 0.15, the acid test ratio for DIAMINESQ.NS is 5.61, DIAMINESQ.NS has an inventory turnover of 3.36, and DIAMINESQ.NS has debt-to-equity ratio of 0.00.
The DIAMINESQ.NS whose company name is Diamines and Chemicals Limited has made profit/loss of 444264000 with total revenue of 1028273000, DIAMINESQ.NS has assets worth of 1626757000.
1. What is fundamental analysis?
Fundamental analysis is looking into a company’s real business performance by analyzing financial statements, earning reports, and key valuation ratios.
Basically, fundamental analysis involves examining a company’s revenue, profits, losses, debts, assets, liabilities, and ratios calculated using these values to determine long-term investment strategies.
Fundamental analysis may not work for short-term trading of stock; it is usually incorporated by long-term investors.
2. Importance of Fundamental Analysis
Imagine you are locking a good amount of funds into an unknown company for many years. Sounds stupid, right?
This is where fundamental analysis comes into the picture, which turns an unknown enemy into a known friend.
As fundamental analysis involves calculating how a company is actually performing, the real revenue, profits, assets, liabilities, debts, and more. This helps investors to determine what the actual current financial condition of the company is, how much the company’s stock price is justified when compared to earnings (Corporate earnings reports India) that it is making through business, what the probability is that the company will go bankrupt in the future, how much growth the company has shown in the past, and other financial ratios.
All these calculations and analyses determine the financial health of the company, historical business growth, company’s efficiency, and its stock price compared with real earnings (Corporate earnings reports India), which helps traders to make investment decisions for long-term investment strategies.
2. How to Use Our Tool
- Search for the stock that you want to analyze in the search bar by typing the name of the company or ticker.
- Once you land on the Stock Analytics Page, click on “Fundamental Analysis”; this will take you to the fundamental analysis page.
- On the “Fundamental Analysis” page, the first tab is for “Summary and Ratio,” where in the top section you can find the overall summary of the stock’s fundamental analysis, where on the leftmost side it has a textual summary, then in the middle a gauge chart that represents overall financial health, and then a list of important ratios.
- Then in the same “Summary and Ratio” tab, we have included a detailed analysis of stock in various aspects, which includes “Profitability Analysis,” “Liquidity Analysis,” “Efficiency Analysis,” “Coverage Analysis,” Solvency Analysis,” and “Market Analysis,” which divide the stock’s fundamentals into the above aspects and analyze each in the same format as for overall analysis, where the leftmost side has a textual summary, then in the middle a gauge chart that represents overall analysis of the particular section, and then a list of important ratios. Required for the particular analysis.