Technical Analysis
| Risk Value | ₹1 |
|---|---|
| Risk % | 11.11% |
| Volatility | ₹0.30 |
| Last 50 Day High | ₹13.04 |
| Last 50 Day Min | ₹8.74 |
| Predicted Resistance | ₹10.42 |
| Predicted Floor | ₹8.64 |
| News | Sentiment |
|---|---|
| Elections 2024, smallcaps: RattanIndia Power, Cochin Shipyard, BDL, Garden Reach, Mazagon equities rally rise to 100% | Neutral |
| RattanIndia Power equities lose steam after hitting one-year high, dive 10% in 2 days; should you book profit? | Positive |
| Hot shares on November 20: Tata Investment, YES Bank, Bank of Baroda, Suzlon Energy and more | Positive |
| Sensex jumps over 500 points, Nifty trades near 19,150; JK Tyre zooms 12%; Gujarat Mineral decline by 10% | Positive |
| Hot shares on September 15, 2023: Adani Green, UCO Bank, RattanIndia Power, Sequent Scientific and more | Positive |
| Hot shares on June 28, 2023: Bikaji Foods, Rain Industries, Kitex Garments, Titagarh Rail and more | Positive |
| Hot shares on June 27, 2023: Delta Corp, Time Technoplast, RattanIndia Power, Brightcom Group and more | Positive |
| RattanIndia Power equities extend gains, jump 7% to reached one-year high levels today; what's pushing this security up? | Positive |
| Sensex slips 9 points, Nifty settles below 18,700; Shree Cement, CreditAccess Grameen fall rise to 6%; RattanIndia Power rise 20% | Neutral |
| RattanIndia Power equities zoom 20% to trade near one-year high levels; here's why | Positive |
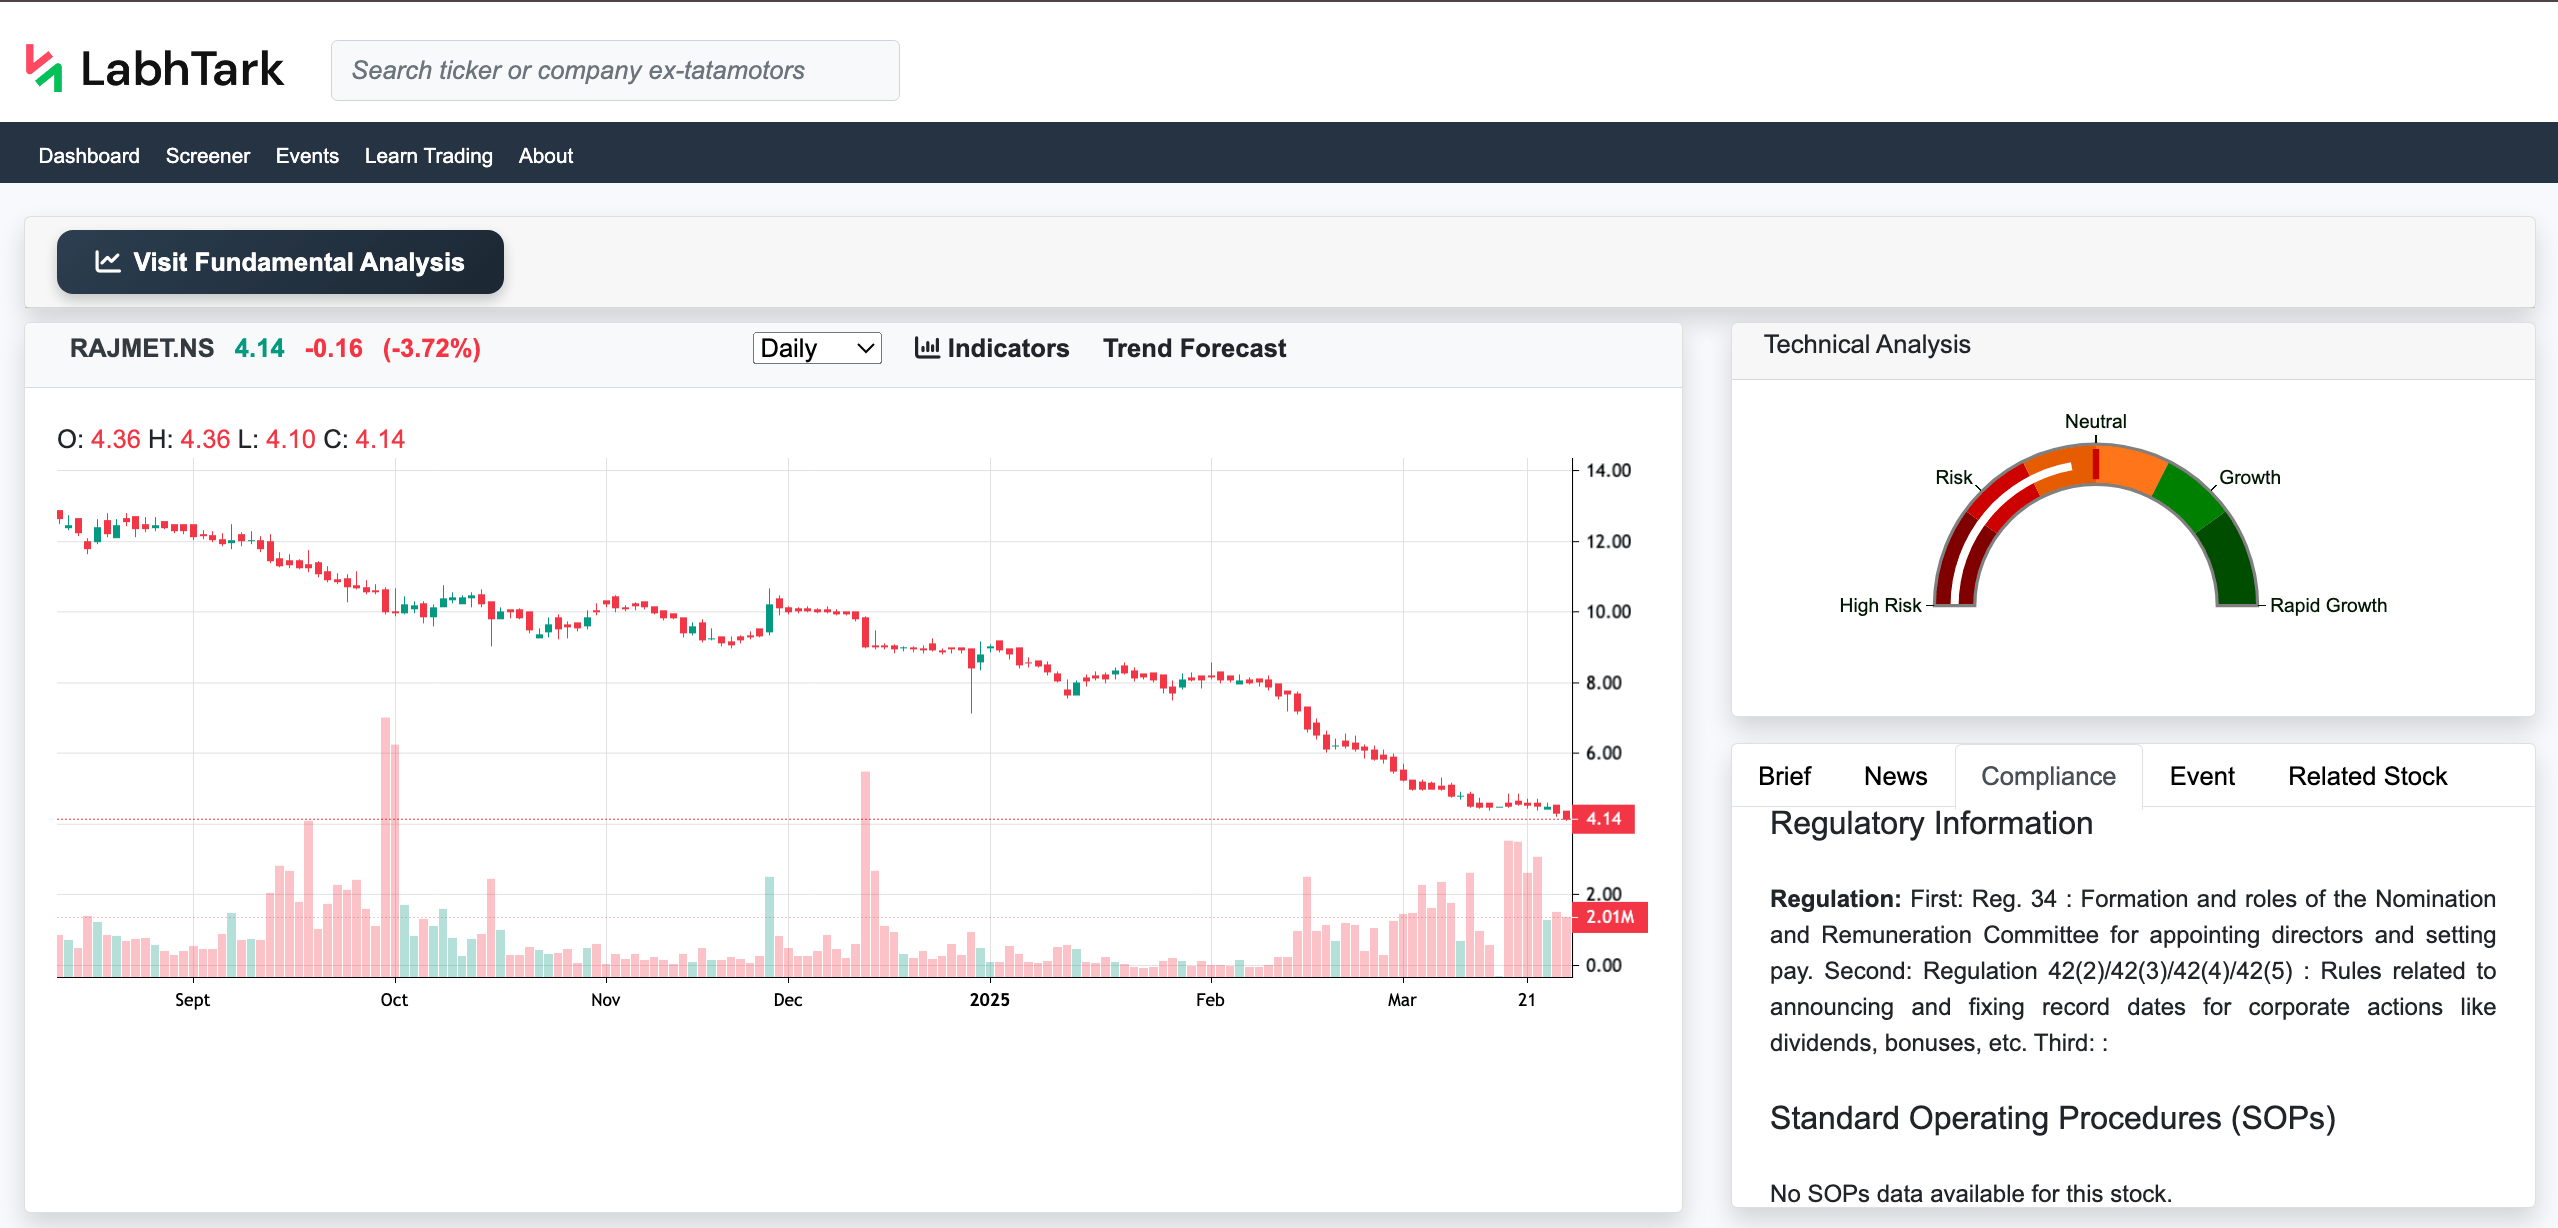
Regulatory Information
Regulation: First: Reg. 17 : Deals with the overall board composition and its functions for corporate governance. Second: : Third: :
Standard Operating Procedures (SOPs)
No Event data available for this stock.
Please check back later for updated information.
Summary
Technical Overview Of RTNPOWER.NS (RattanIndia Power Limited)
Above is the summary for the technical analysis of RattanIndia Power Limited, whose ticker name is RTNPOWER.NS and belongs to sector Utilities, and it is listed in NSE (National Stock Exchange).
The RattanIndia Power Limited has a current value in NSE (National Stock Exchange) of , and the RattanIndia Power Limited, whose ticker name is RTNPOWER.NS, has changed from the previous closing value.
The RTNPOWER.NS, which is RattanIndia Power Limited, has a risk value of ₹1, volatility of ₹0.30, and the RTNPOWER.NS has a last 50 days high value of ₹13.04, RTNPOWER.NS and a last 50 days min value of ₹8.74.
And the company has the following upcoming events:
No Event data available for this stock.
Please check back later for updated information.
1. What is Technical Analysis and Nifty 50 analysis
Technical analysis helps traders and investors to determine the current trend (uptrend, downtrend, or sideways trend), seasonality, patterns in the chart of the stock, and whether the stock is overbought or oversold to ultimately predict whether the stock will go up or down in the future.
Basically, traders use historical stock prices, including ("Open," "Close, High," "Low") to drive various insights for the stock, and it also involves using technical indicators, which are nothing but mathematically calculated values using stock historical prices to generate more insights.
Also, there are various patterns that are formed in the chart of historical data of stock, which also conveys some insights about how stock is going to perform in the future.
For more details, visit the below link to learn how to perform technical analysis:
Technical Analysis2. Importance of Technical Analysis
While technical analysis does not incorporate any financial data of a company’s business still, technical analysis gives good insight about how stock will perform mostly for the Short-term trading strategies.
As the price of stock tends to follow trend and seasonality, it becomes important to perform technical analysis to find out the current trend (uptrend, downtrend, or sideways trend), seasonality, patterns in the chart of the stock, and whether the stock is overbought or oversold so that traders can predict where the stock can go in the current scenario, also helps with Nifty 50 analysis which is Indian stock market indices
3. How to Use Our Tool
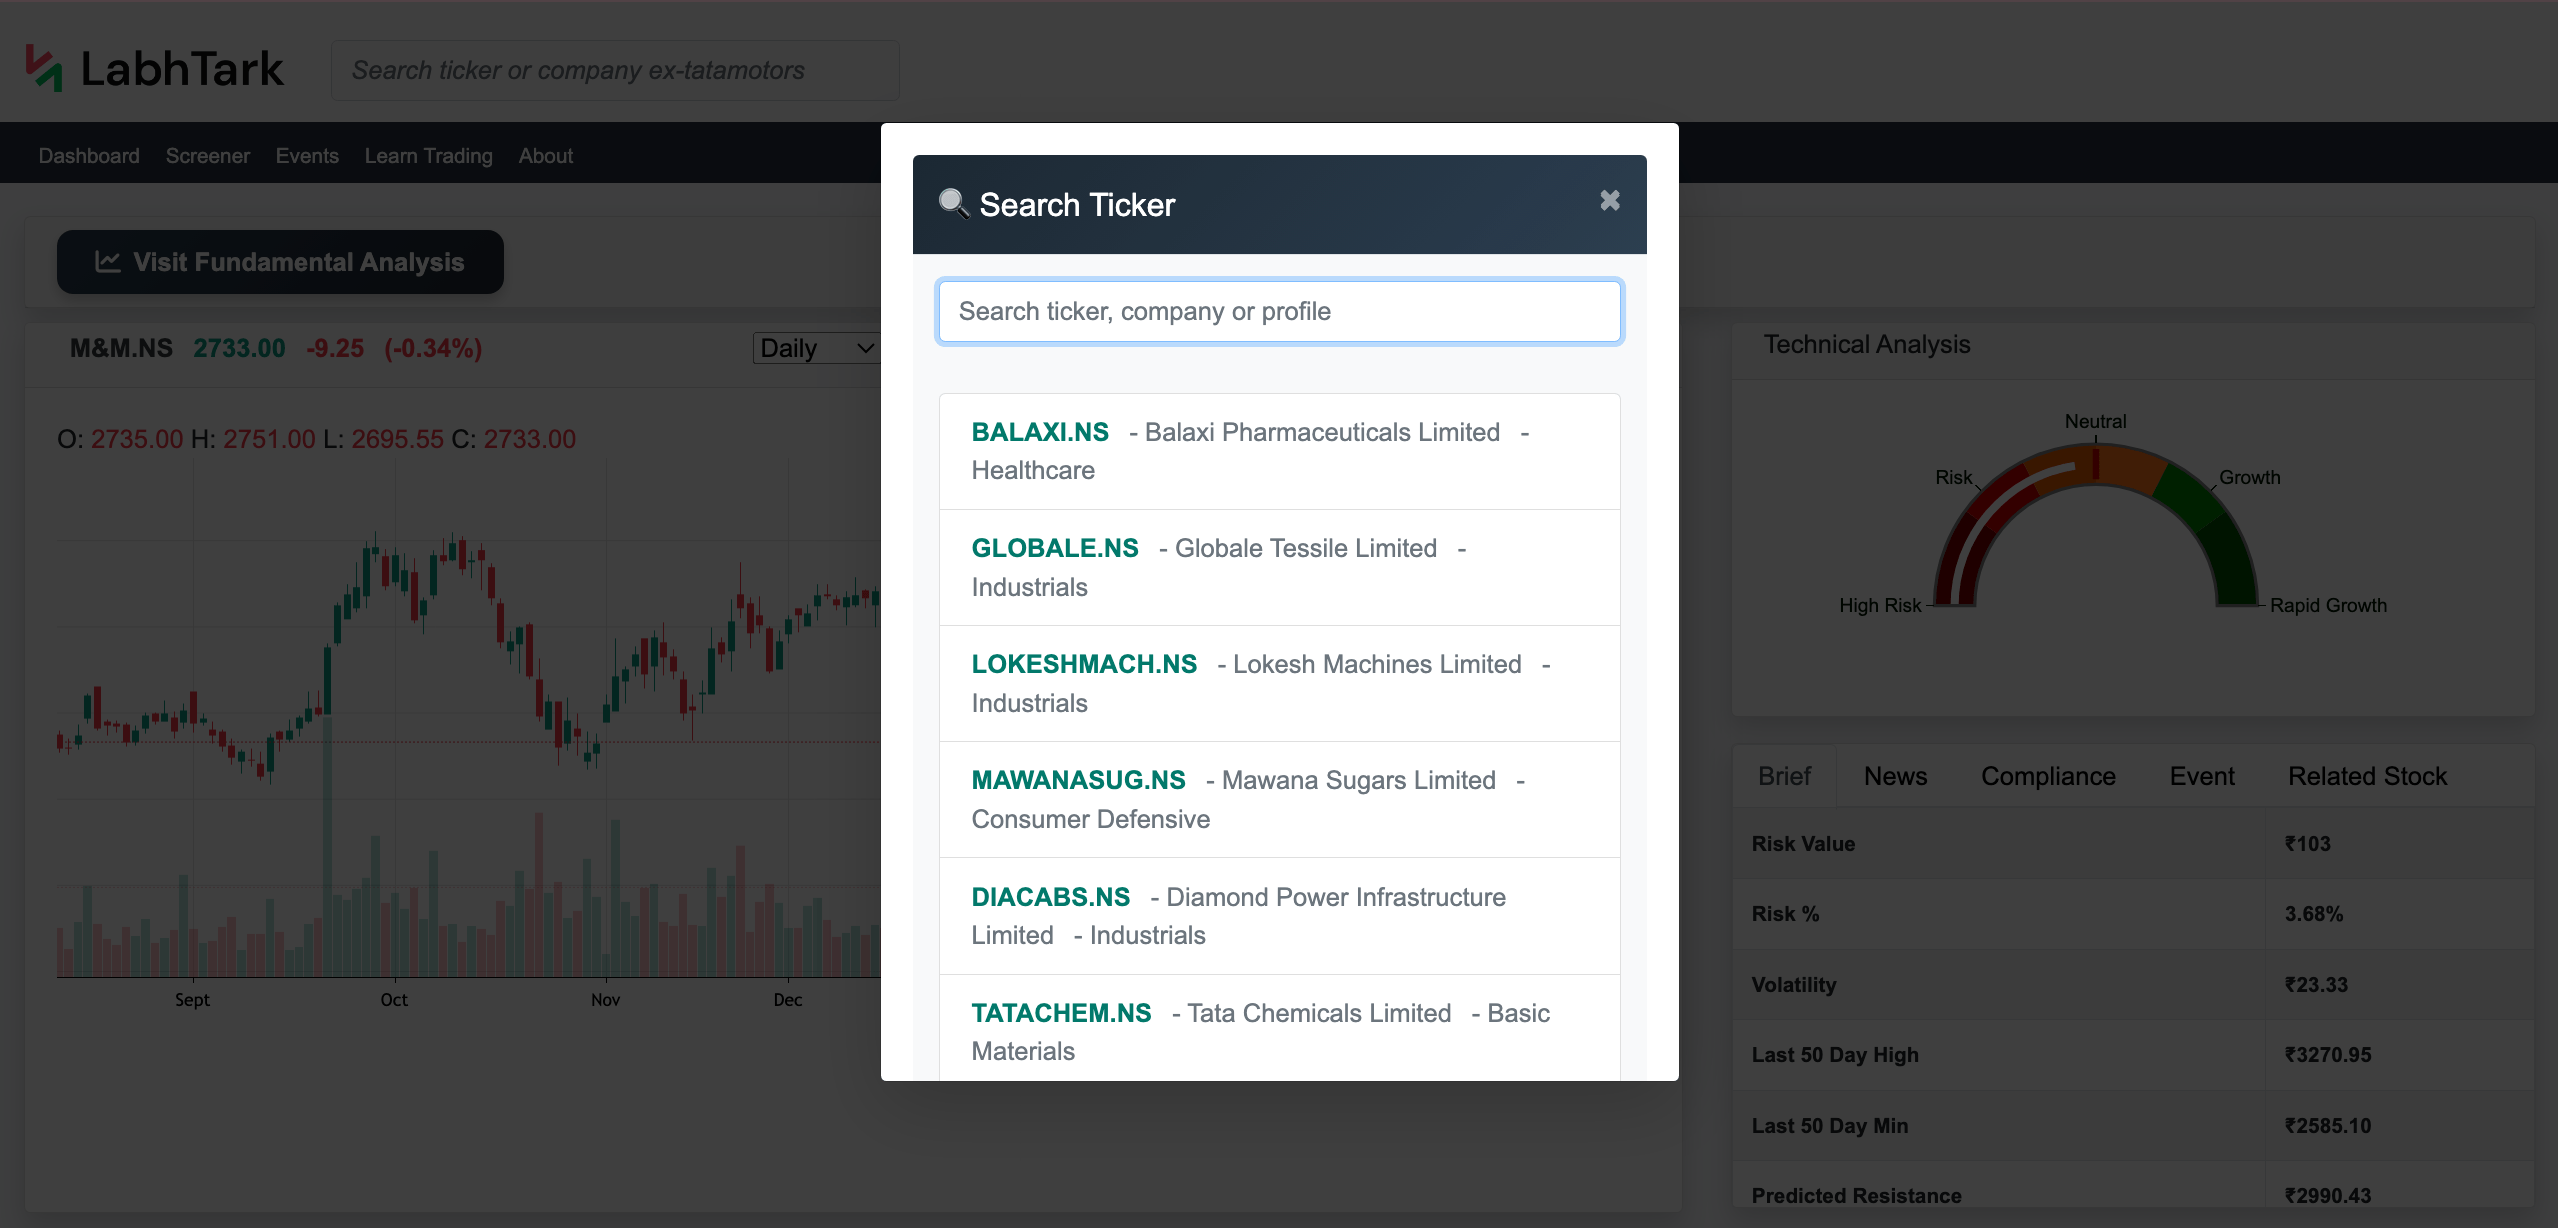
LabhTark provides a robust tool to perform stock technical analysis.
- Users need to search for the company or stock they want to analyze in the search bar, also they can search for Nifty50 or Sensex index for Nifty 50 technical analysis, and Sensex technical analysis
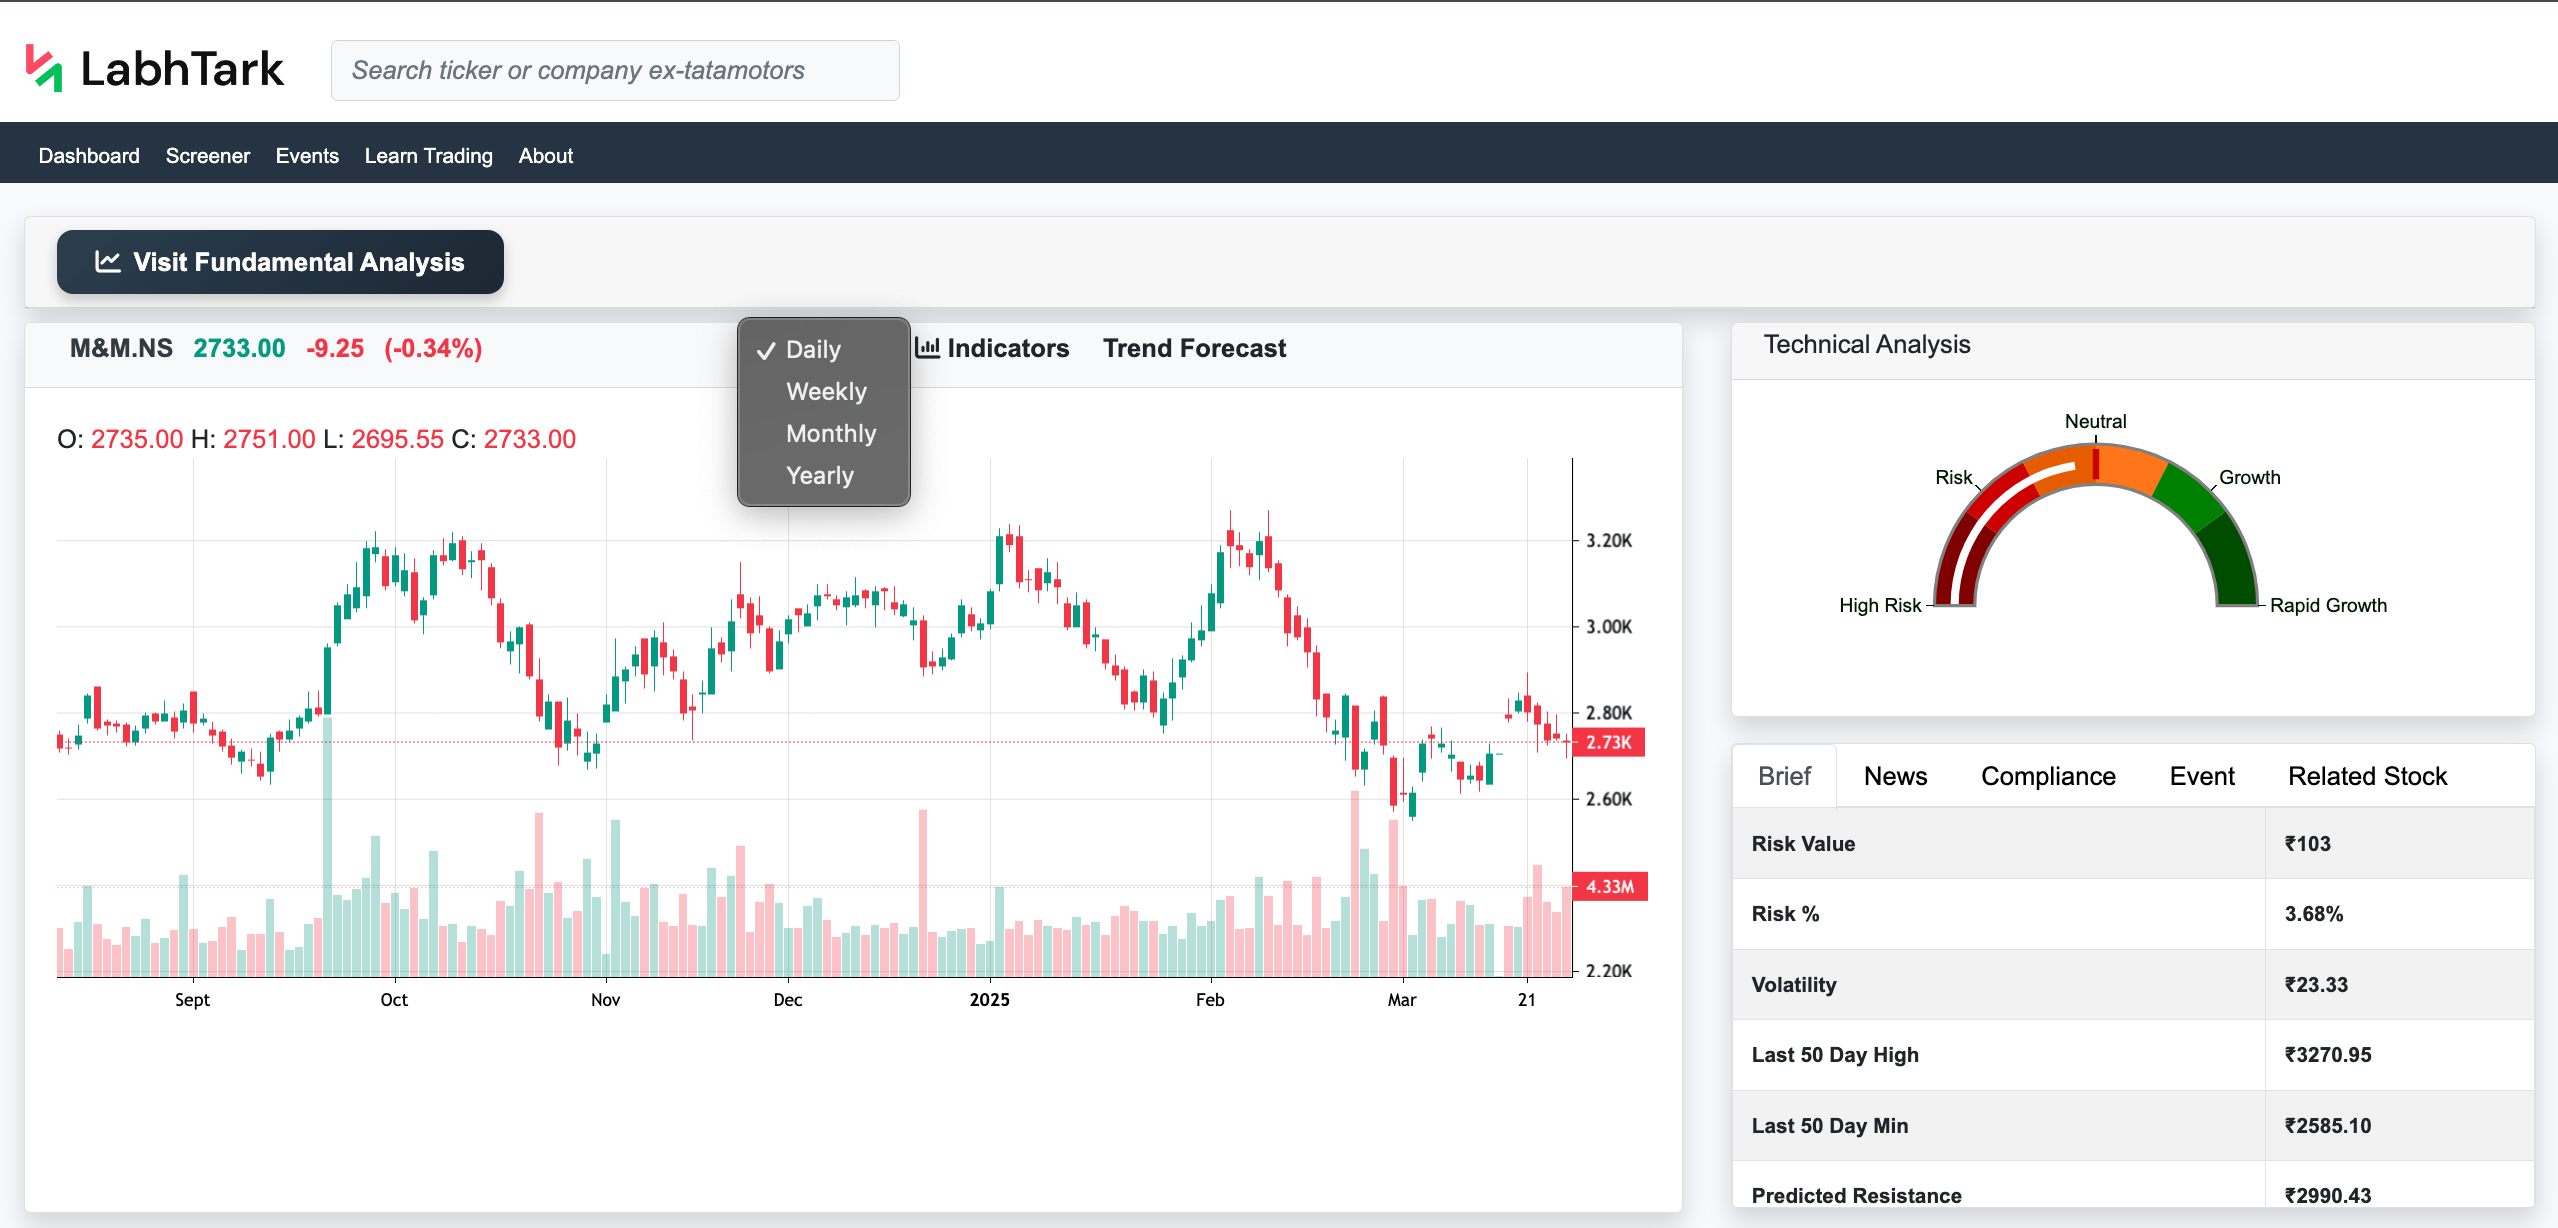
- Once the page is loaded, we have historical data with a candle chart in the left and in the right corner we have all the analysis.
Features of Candle Charts
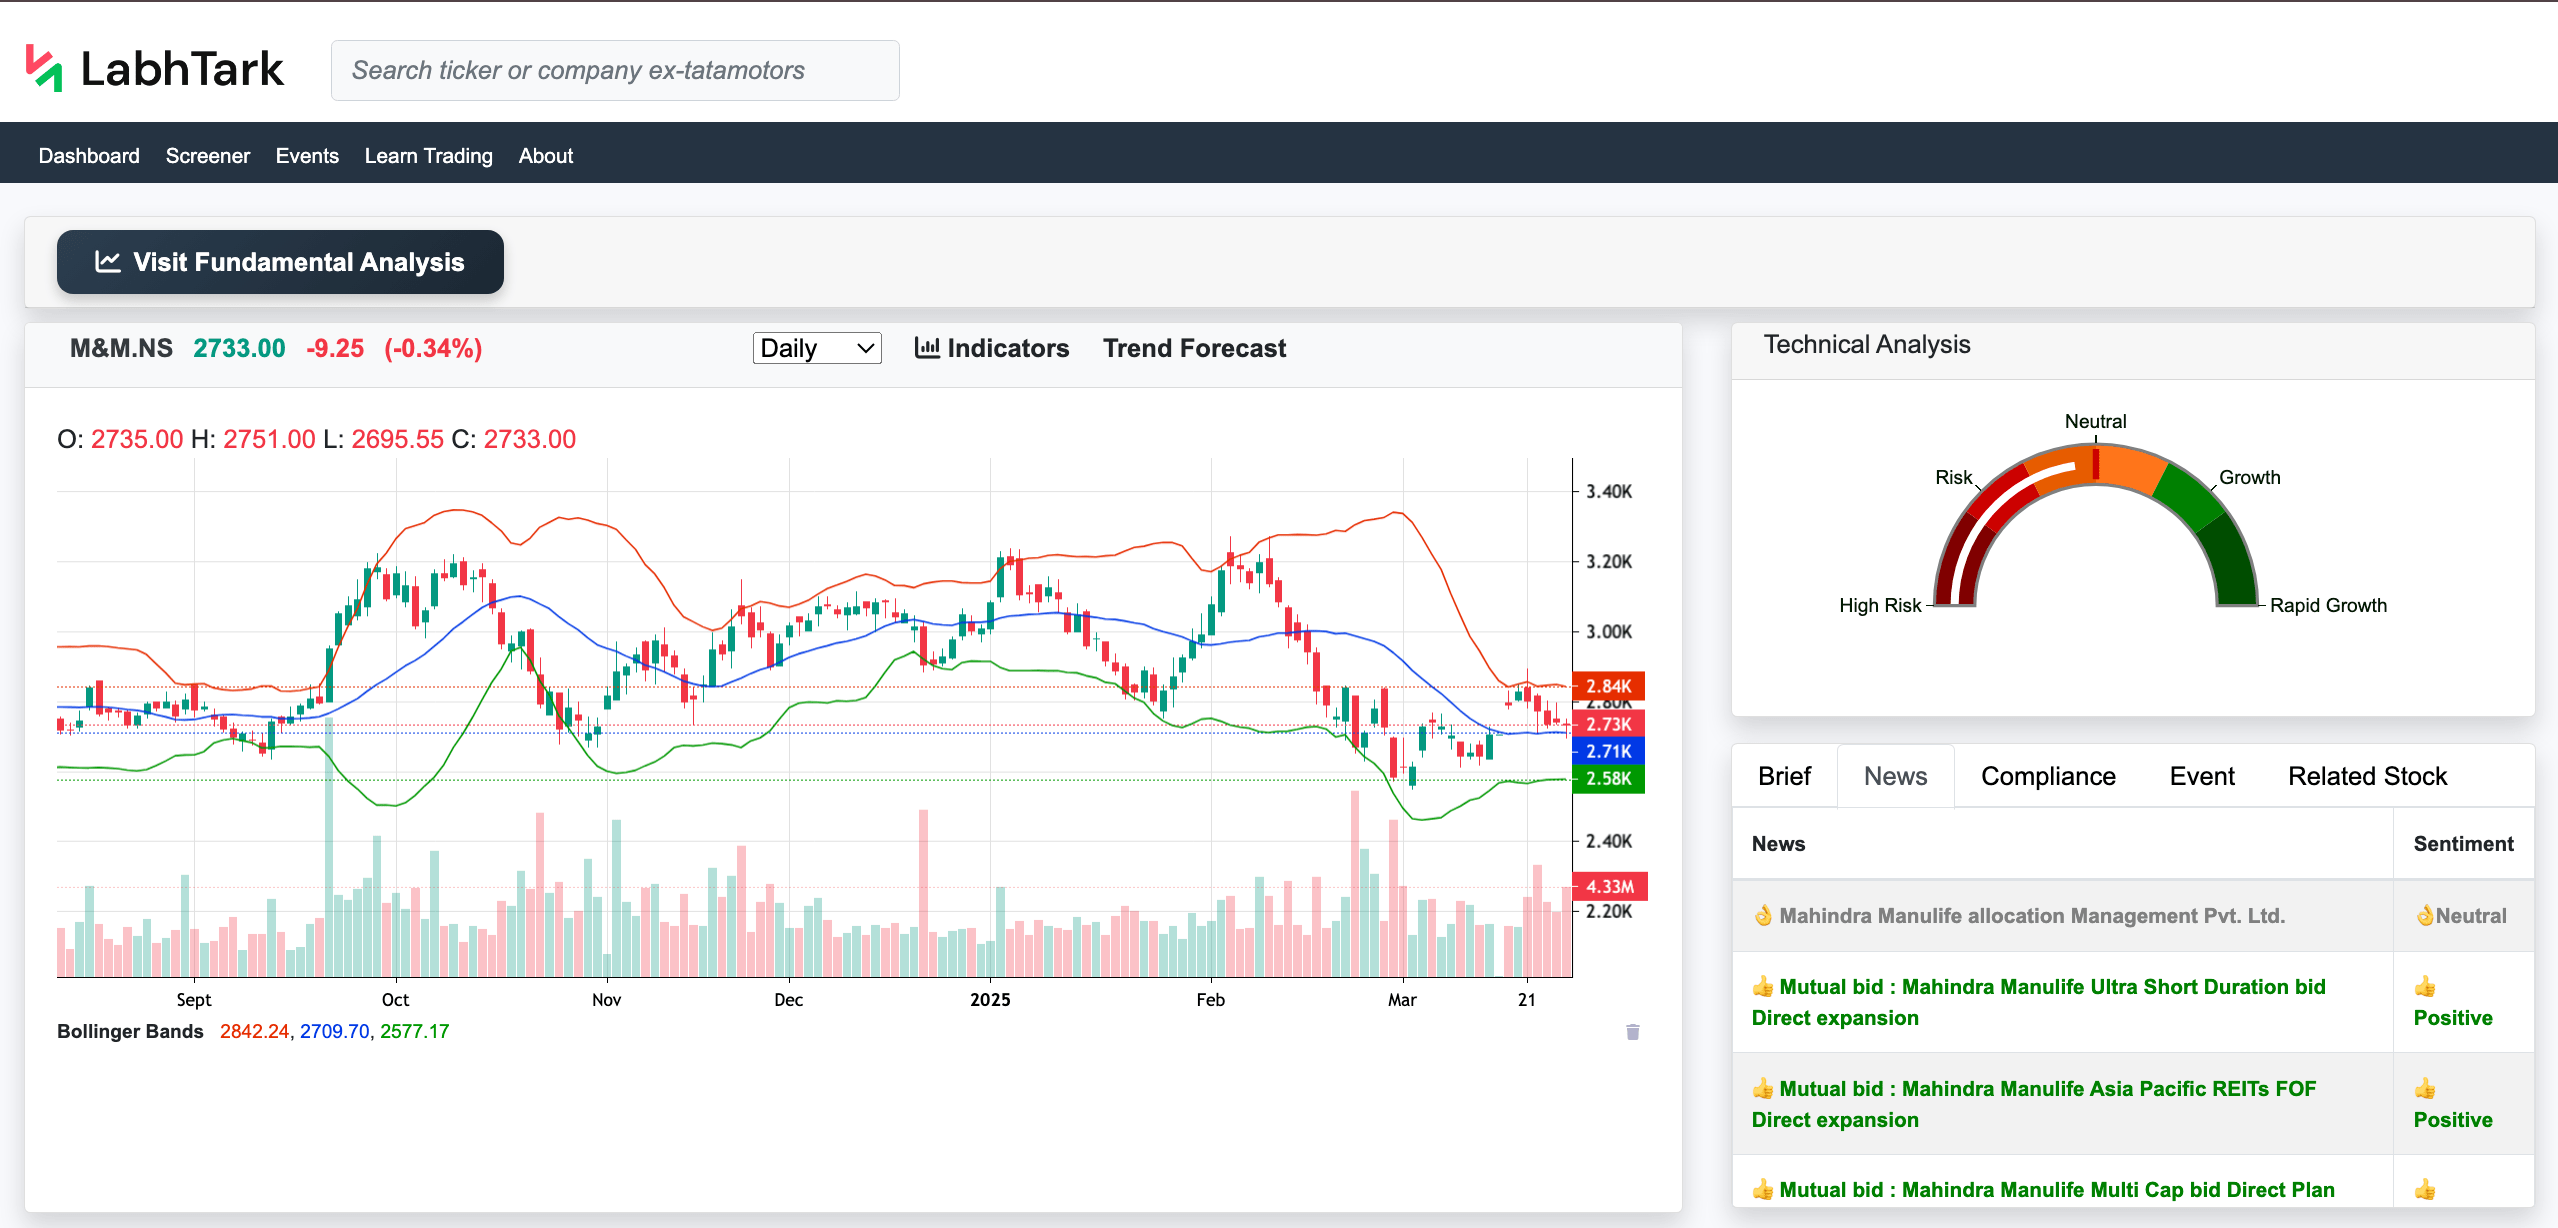
- In our candle chart of the stock, the user can determine the current closing price of the stock in the top, with change from previous value.
- Then the user can select the granularity of the chart, i.e., daily, weekly, monthly, or yearly.
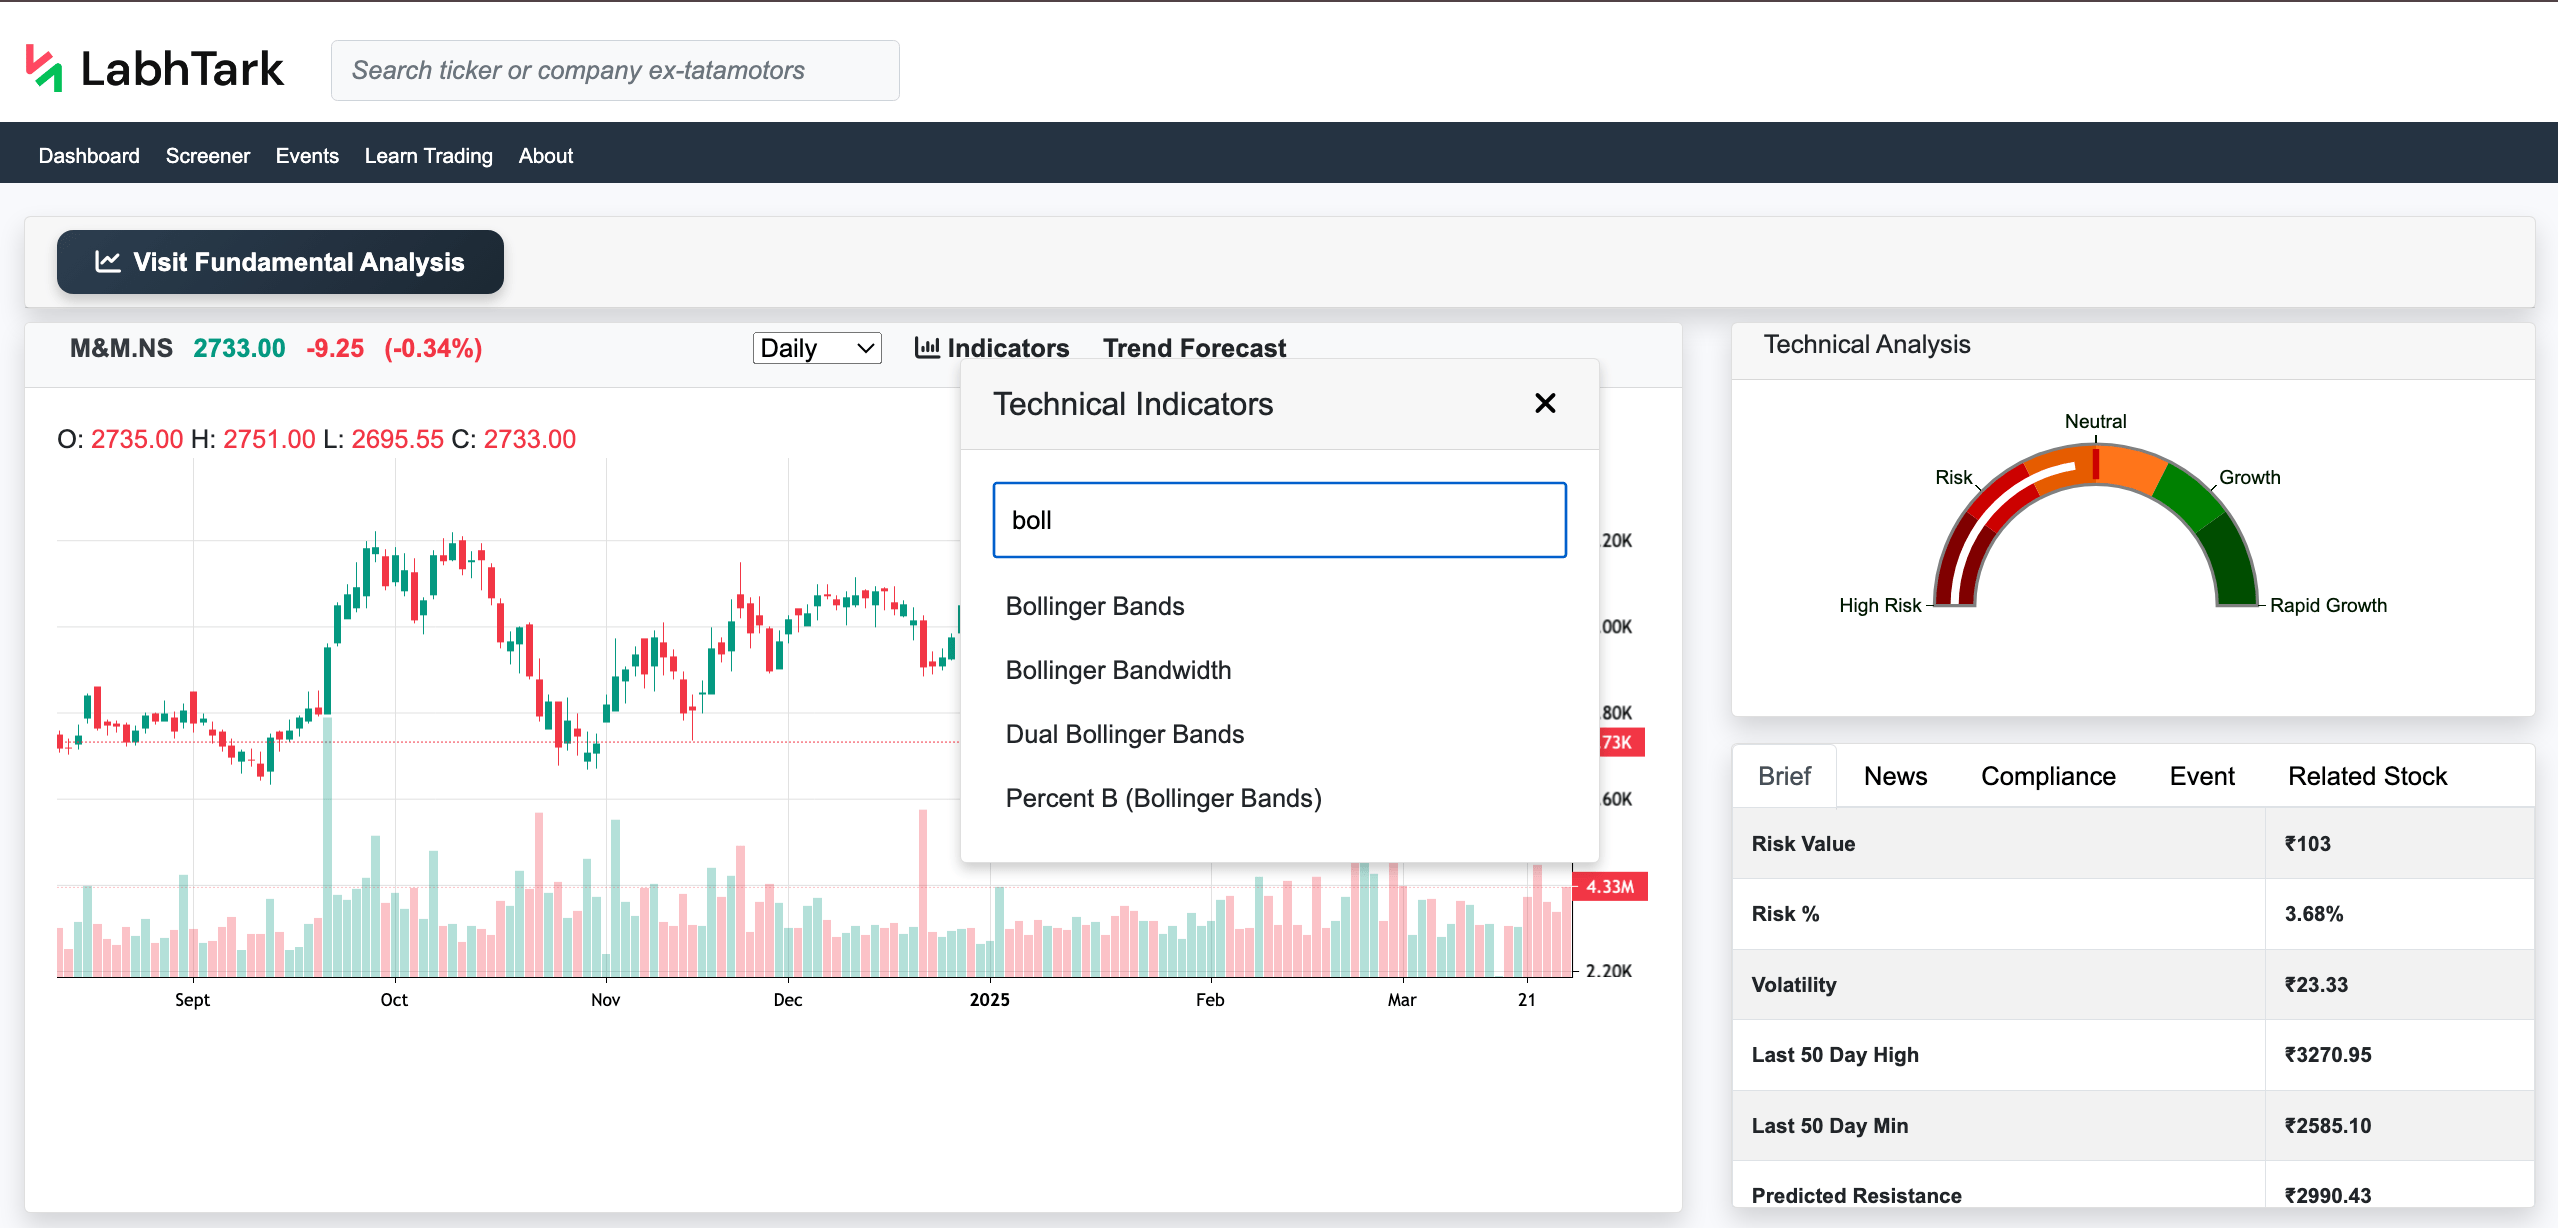
- Then the user can add a chart for indicators, like RSI, ATR, Bollinger Bands, and other more than 40 indicators, to learn how these indicators give insight for the stocks, visit the "Learn Trading" section of LabhTark and select Technical Indicators to learn it, or click the below link to reach it directly.
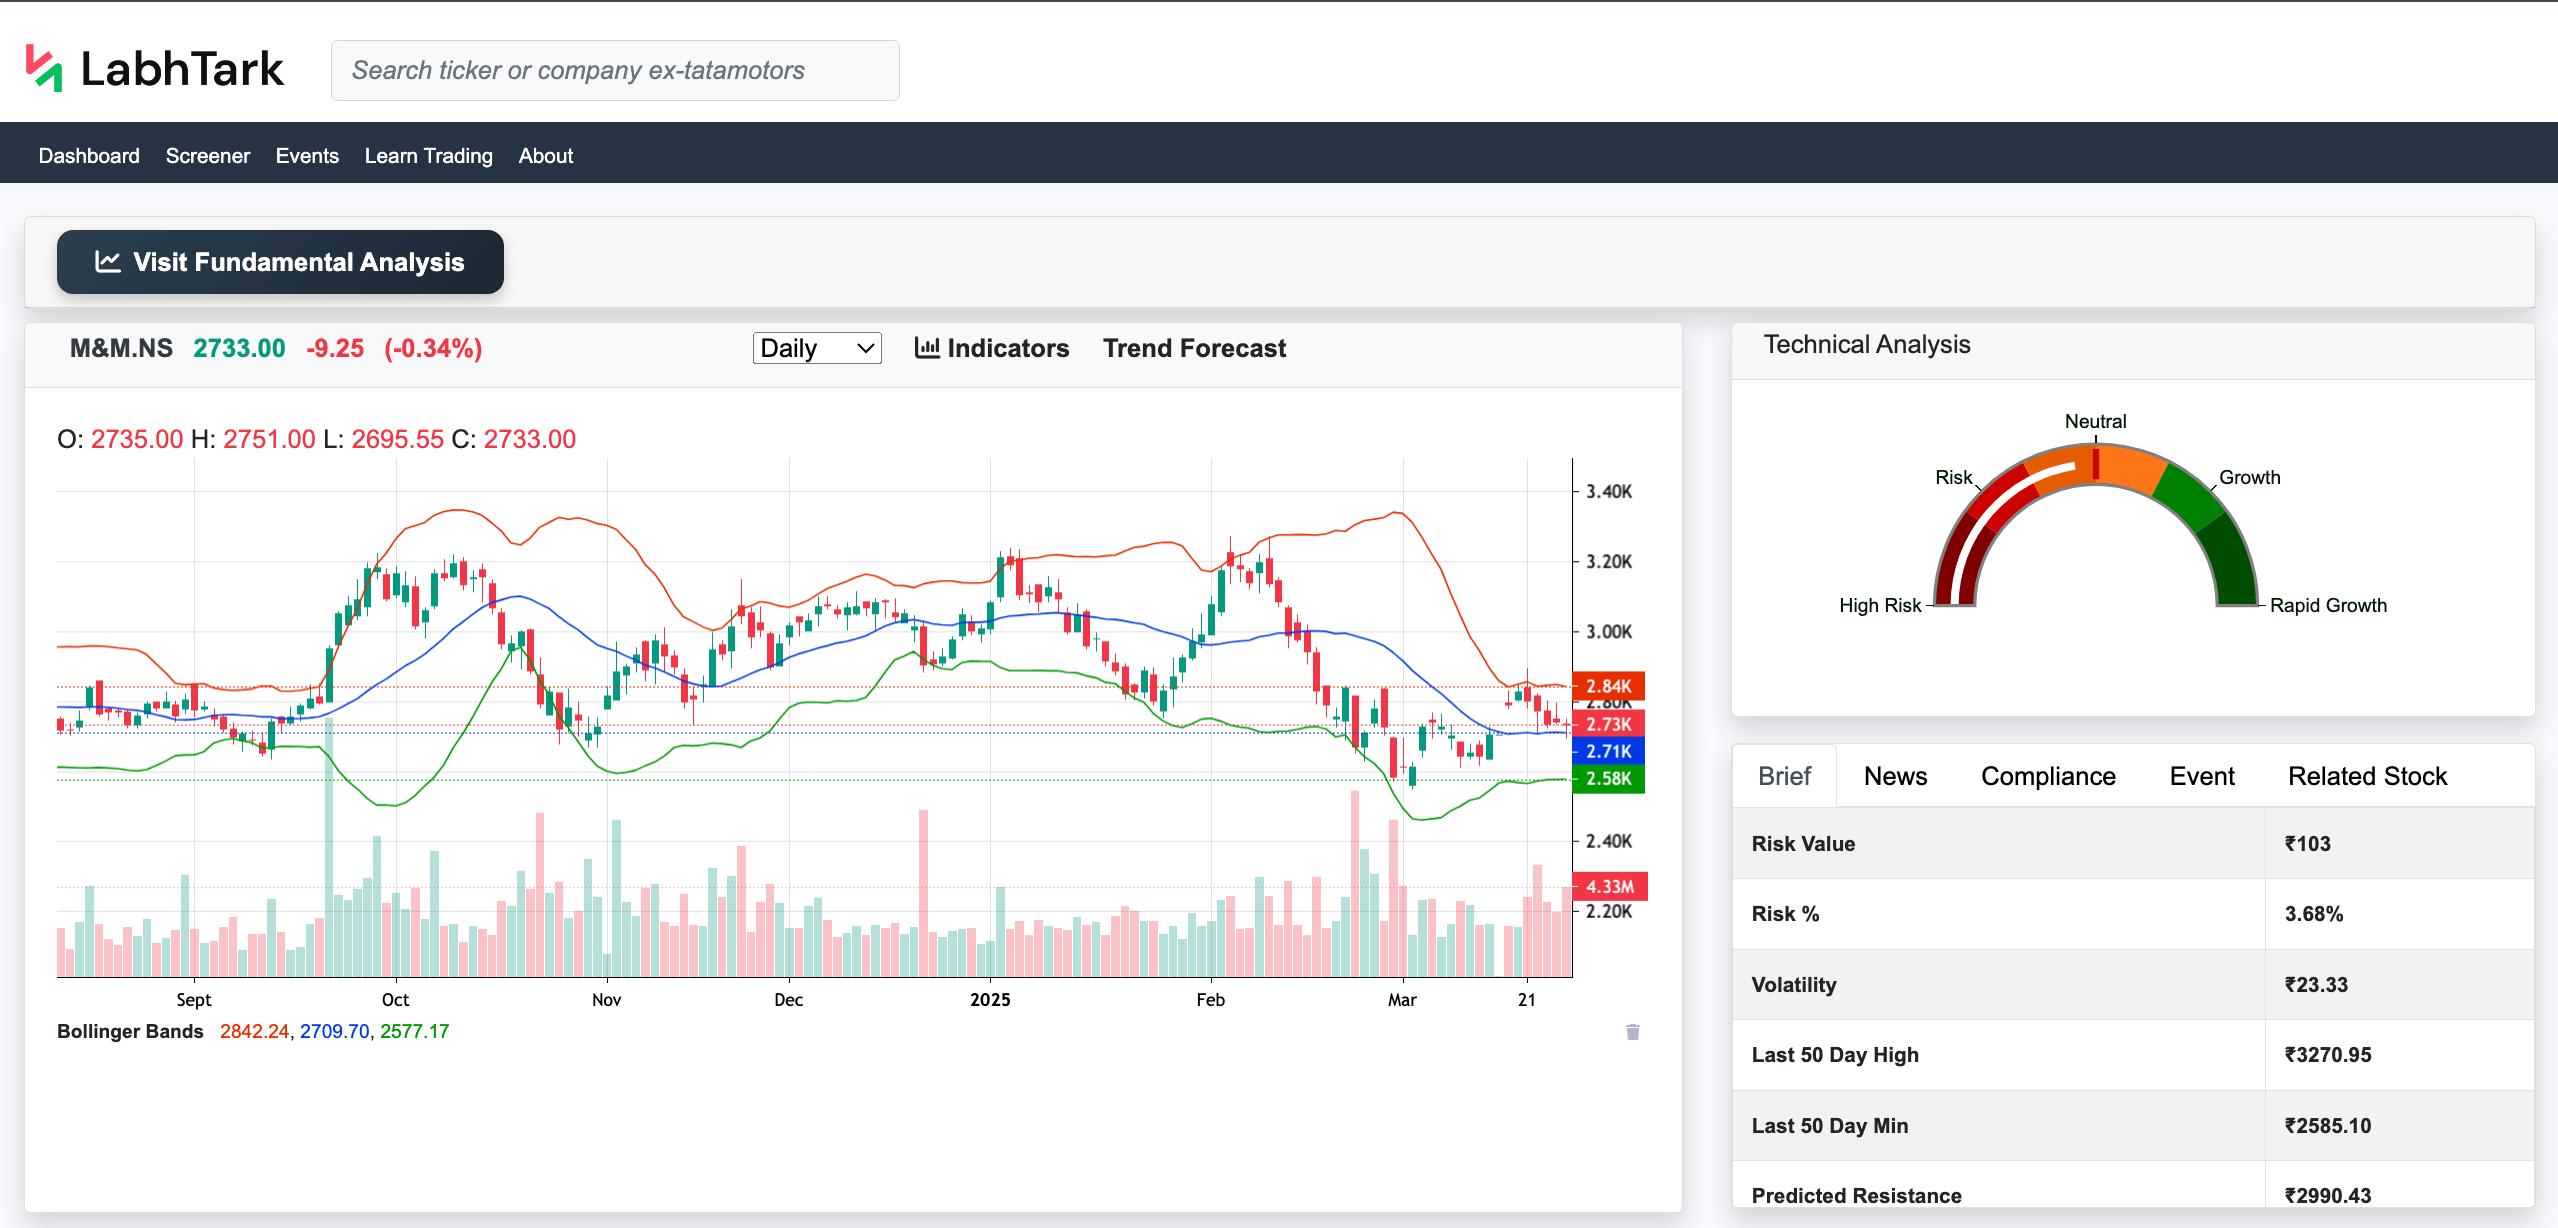
- Then the user can analyze the stock by scrolling the chart left and right to see full historical data.
Feature of Analysis
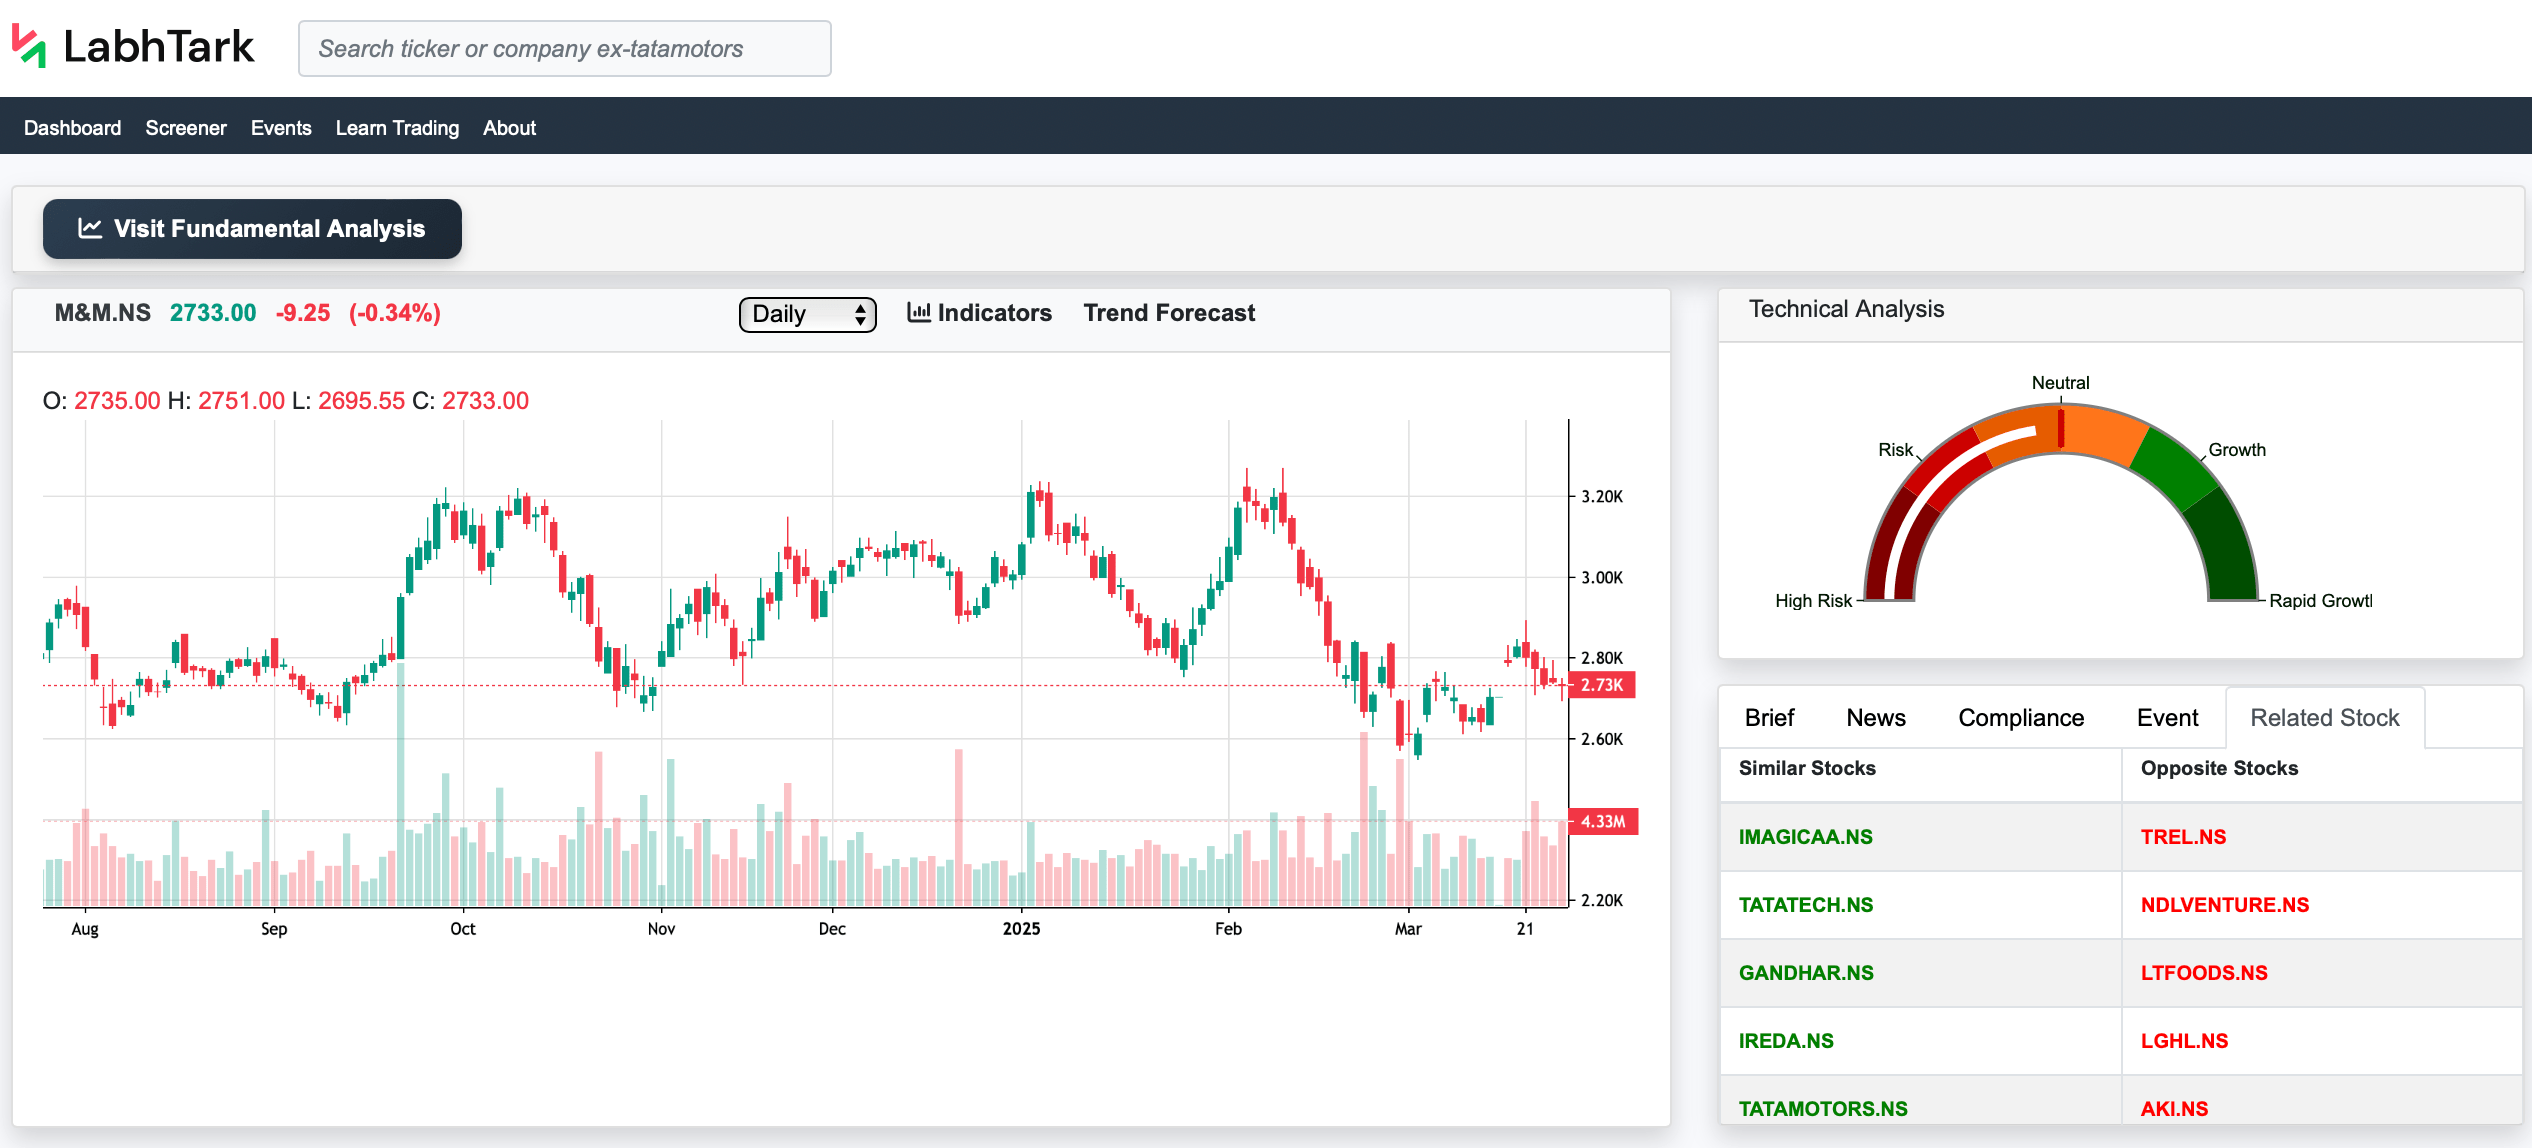
- In the top right, the user can get an overall insight into the stock from the gauge chart, which indicates if the stock is “High Risk," “Risk," “Neutral," “Growth,” or “Rapid Growth.”
- Next we have multiple tabs for a brief of the stock, news, compliance, events, and related stocks.
- In the “Brief” tab we have all the important data points in the tabular form, like the last 50 days high or the last 50 days min.
- In the “News” tab we have news related to this particular stock, latest stock market news India with sentiment analysis, where green represents positive news, red represents negative news, and grey represents neutral news.
- In the “Compliance” tab we have data related to compliance for this particular stock, which informs whether the stock has any legal compliance going on currently, which makes it risky for the investment.
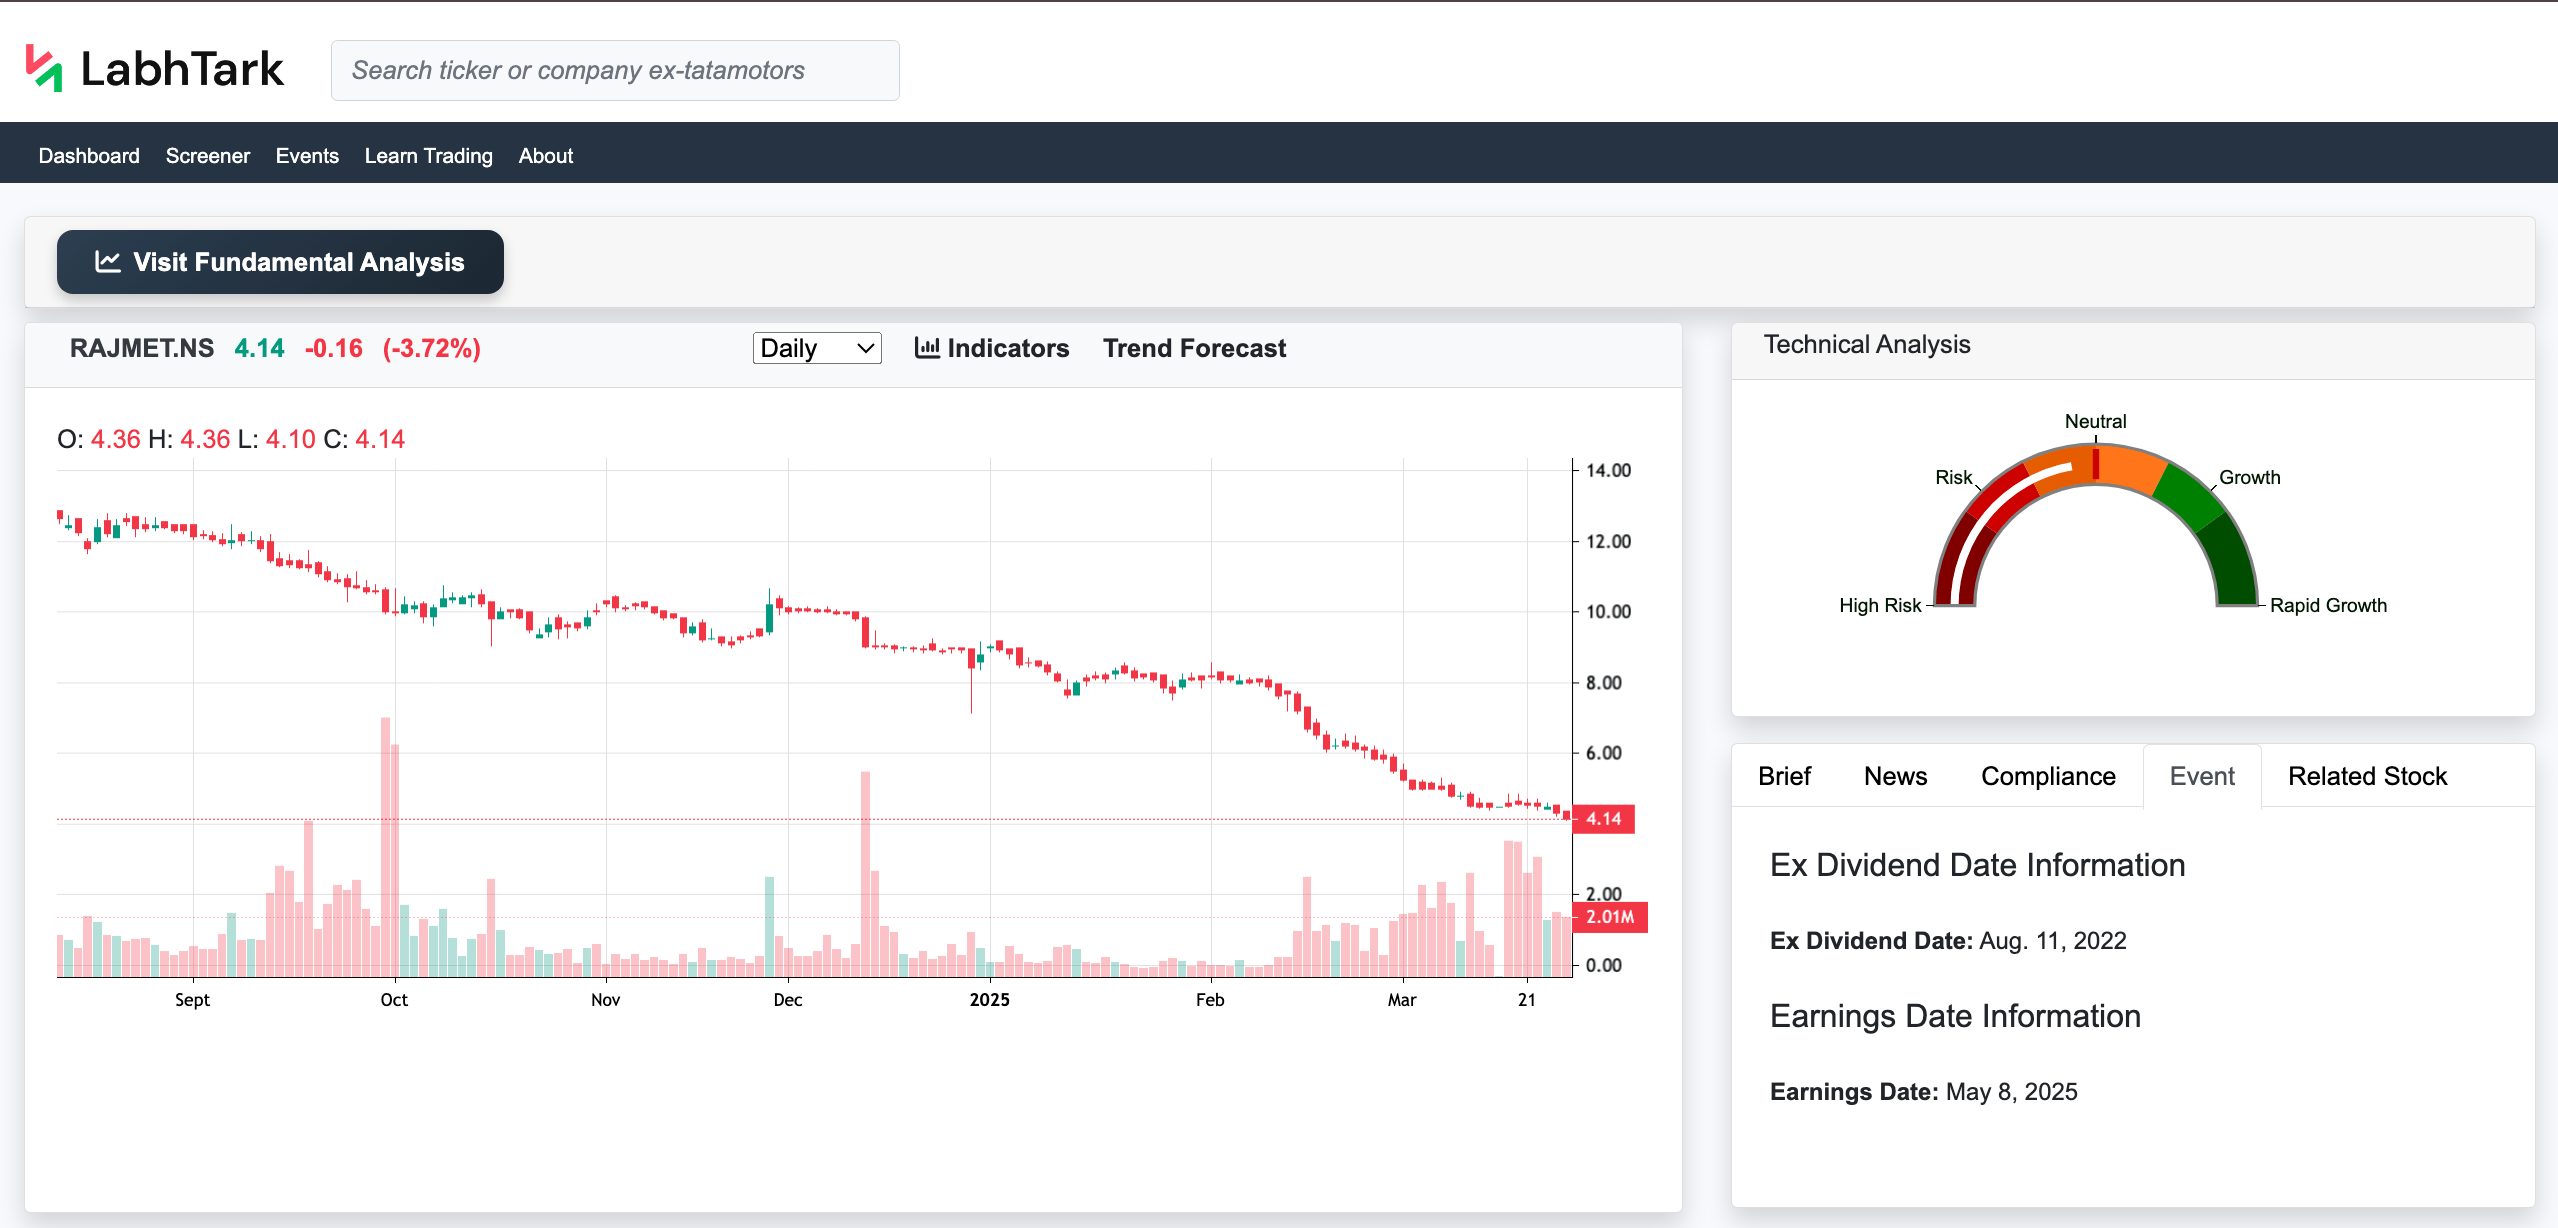
- In the “Events” tab we have important dates related to this particular stock, like ex-dividend dates for Dividend investing in Indian stocks and earnings date information, for Corporate earnings reports India
- In the “Related Stocks” tab we have a list of stocks that are either similar to this stock or opposite.
4. How to perform technical analysis
Technical analysis may sound complicated, but it has four basic parts to predict the future value of a stock’s price and guide to stock chart patterns
1. Trend Indicators
This determines what the current trend (uptrend, downtrend, or sideways trend) of the stock is; below are some examples of indicators for this.
- EMA (Exponential Moving Average)
- Adaptive Moving Average (AMA)
2. Momentum Indicators
This determines whether stock is overbought or underbought so that traders can decide whether to buy or sell this stock; below are some examples of indicators for this.
- Relative Strength Indicator (RSI)
- Stochastic Oscillator
3. Volatility Indicators
This determines how far stock can move up or down in the coming future, basically the volatility of the stock; below are some examples of indicators for this.
- Average True Range (ATR)
- Bollinger Bands
4. Volume Indicators
This determines how stock is performing according to its volume; below are some examples of indicators for this.
- Volume weighted average (VWAP)
- On-Balance Volume (OBV)