RELIANCE
NSEEntry Point
< ₹1487
Stop Loss
₹1369
Target
₹1542
Holding Period
2 Days
Last 50 Day High
₹1531.90
Last 50 Day Min
₹1300.40
Violation
No
Earnings call
July 17, 2025
Ex dividend
Aug. 19, 2024
| News | Sentiment |
|---|---|
|
MUMBAI (Reuters) -State Bank of India (SBI) is classifying the loan account of insolvent Reliance Communications while fraudulent, citing alleged diversion of cash in a case dating support to 2016. The disclosure was made by Reliance Communications in a stocks filing that attached a June 23 letter from SBI detailing the factors behind the decision by India's biggest lender. Under Indian banking laws, once an account is reported while fraudulent, the matter is referred to enforcement agencies for criminal action and the borrower is barred from securing additional finance from banks and other regulated fundamental institutions for an initial period of five years. |
Negative |
|
MUMBAI (Reuters) -Indian billionaire Mukesh Ambani's Reliance Industries stated it will spin off its consumer goods unit into a new entity to allow the fast-growing business to attract investors beyond those support its individual unit. Reliance's consumer business includes brands such while Campa Cola, which competes with Coca-Cola and Pepsi, and dozens of other snacks and confectionery brands that fight for shelf space with the likes of Mondelez's Cadbury chocolates. India's National firm Law Tribunal has approved the internal restructuring under which Reliance will transfer its consumer business from its individual arm into a direct subsidiary, New Reliance Consumer Products Ltd, as per to an order dated June 25, which was first reported by Indian media on Thursday. |
Positive |
|
Trump Family’s New Business associate Is India’s Richest Man The predict with the Ambani conglomerate is part of a foreign dealmaking spree with the first family.
|
Positive |
|
OpenAI is looking to increase more cash to fuel its model development and ambitious infrastructure plan Stargate, with the financing driven by SoftBank. previous this year, OpenAI CEO Sam Altman met with India's IT Minister and discussed India's plan of creating a low-cost AI ecosystem, following which Altman additionally had plans to visit UAE to discuss raising cash with Abu Dhabi allocation group MGX, two sources with knowledge of the matter told Reuters. |
Positive |
|
CD&R joins race for BP’s $8 billion Castrol unit, Sky report reports Investing.com -- unlisted ownership business Clayton Dubilier & Rice has entered the competition to acquire Castrol, BP (NYSE:BP)’s lubricant business valued at approximately $8 billion, as per to Sky News, citing sources familiar with the matter.
|
Neutral |
|
Brokerages see India's Nifty climbing towards historic highs in July (Reuters) -India's main security indexes are expected to rise towards historic highs in July, powered by sustained domestic inflows, macroeconomic fundamentals and strength in blue-chip firms such while Reliance Industries , two brokerages stated on Friday. The Nifty 50 climbed 2.9% in the June derivatives series that expired on Thursday, while small-caps and mid-caps gained 5.1% and 3.1%, respectively. The Reserve Bank of India's policy support, an uptick in economic growth, moderating price rise and strong domestic inflows have led profits of about 15% each in the Nifty and the Sensex because the start of March.
|
Neutral |
|
exchange Chatter: OpenAI Taps Investors for upcoming Installment of $40 Billion Financing Microsoft (MSFT)-backed OpenAI is tapping Saudi Arabia's listed allocation Fund, India's Reliance In
|
Neutral |
|
Shein Reportedly Making Plans With Reliance to Export India-Made Goods as per to Reuters, the fast-fashion e-tailer is working with Reliance on recruiting more manufacturing partners in India.
|
Neutral |
|
Reliance Industries trims share in India's Asian Paints India’s largest paintmaker is currently facing potential antitrust scrutiny, while its expansion is being challenged by aggressive new entrants like the Aditya Birla Group’s Birla Opus, while well while urban consumers cutting support on discretionary spending. Reliance Industries stated that it has sold the share through affiliate Siddhant Commercials, which until March had a 4.9% share in the paintmaker, market figures showed. after the sale, Reliance Industries will retain approximately 8.7 million shares, which represents a 0.9% share in the company.
|
Neutral |
| Similar Stocks | Opposite Stocks |
|---|---|
| IMAGICAA.NS | ASKAUTOLTD.NS |
| RIIL.NS | UNITEDPOLY.NS |
| JAICORPLTD.NS | EUROTEXIND.NS |
| SAMMAANCAP.NS | MELSTAR.NS |
| JINDALSTEL.NS | FCSSOFT.NS |
What is the sentiment of Reliance Industries Limited stock? (RELIANCE.NS)
Above is the sentiment of Reliance Industries Limited and summary for the technical analysis. whose ticker name is RELIANCE.NS and belongs to sector Energy, and it is listed in NSE (National Stock Exchange).
The Reliance Industries Limited has a current value in NSE (National Stock Exchange) of , and the Reliance Industries Limited, whose ticker name is RELIANCE.NS, has changed from the previous closing value.
The RELIANCE.NS, which is Reliance Industries Limited, share price is , volatility of ₹22.46, and the RELIANCE.NS has a last 50 days high value of ₹1531.90, RELIANCE.NS and a last 50 days min value of ₹1300.40.
And the company has the following upcoming events:
Ex Dividend Date Information
Ex Dividend Date: Aug. 19, 2024
Earnings Date Information
Earnings Date: July 17, 2025
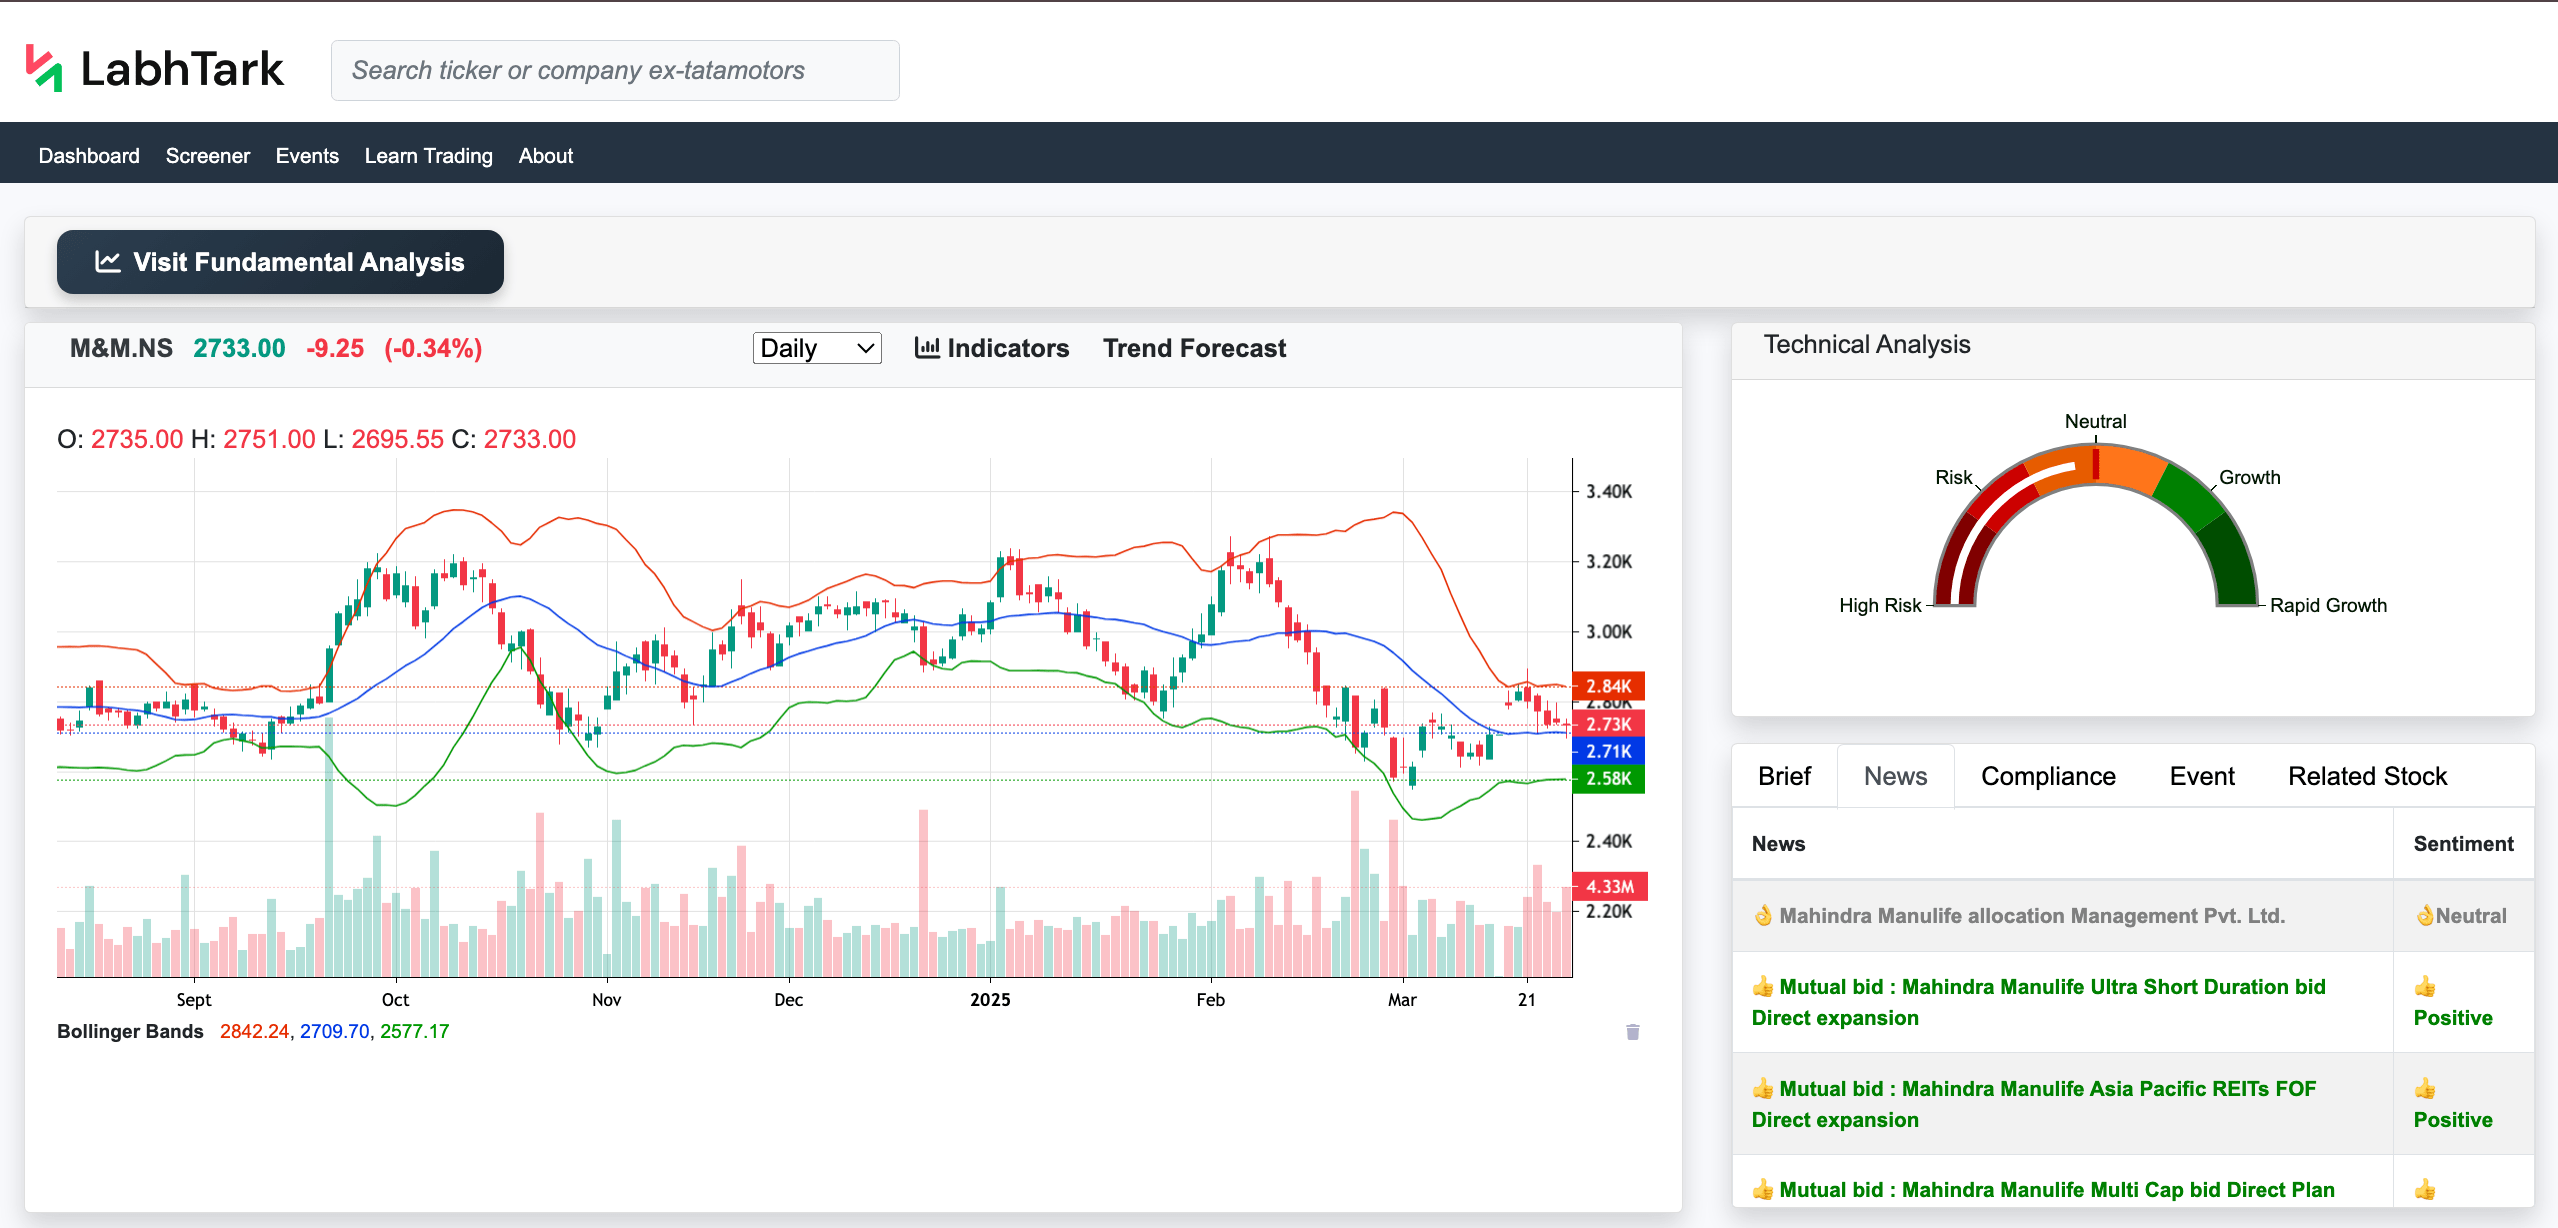
1. What is Technical Analysis and Nifty 50 analysis
Technical analysis helps traders and investors to determine the current trend (uptrend, downtrend, or sideways trend), seasonality, patterns in the chart of the stock, and whether the stock is overbought or oversold to ultimately predict whether the stock will go up or down in the future.
Basically, traders use historical stock prices, including ("Open," "Close, High," "Low") to drive various insights for the stock, and it also involves using technical indicators, which are nothing but mathematically calculated values using stock historical prices to generate more insights.
Also, there are various patterns that are formed in the chart of historical data of stock, which also conveys some insights about how stock is going to perform in the future.
We provide Stock news sentiment analysis, Stock compliance reports India, Stock summary analysis, Technical analysis tools India, Best stock indicators, Real-time stock sentiment along with Stock trend prediction tools.
For more details, visit the below link to learn how to perform technical analysis:
Technical Analysis2. Importance of Technical Analysis
While technical analysis does not incorporate any financial data of a company’s business still, technical analysis gives good insight about how stock will perform mostly for the Short-term trading strategies and Stock forecast India.
As the price of stock tends to follow trend and seasonality, it becomes important to perform technical analysis to find out the current trend (uptrend, downtrend, or sideways trend), seasonality, patterns in the chart of the stock, and whether the stock is overbought or oversold so that traders can predict where the stock can go in the current scenario, also helps with Nifty 50 analysis which is Indian stock market indices.
3. How to Use Our Tool
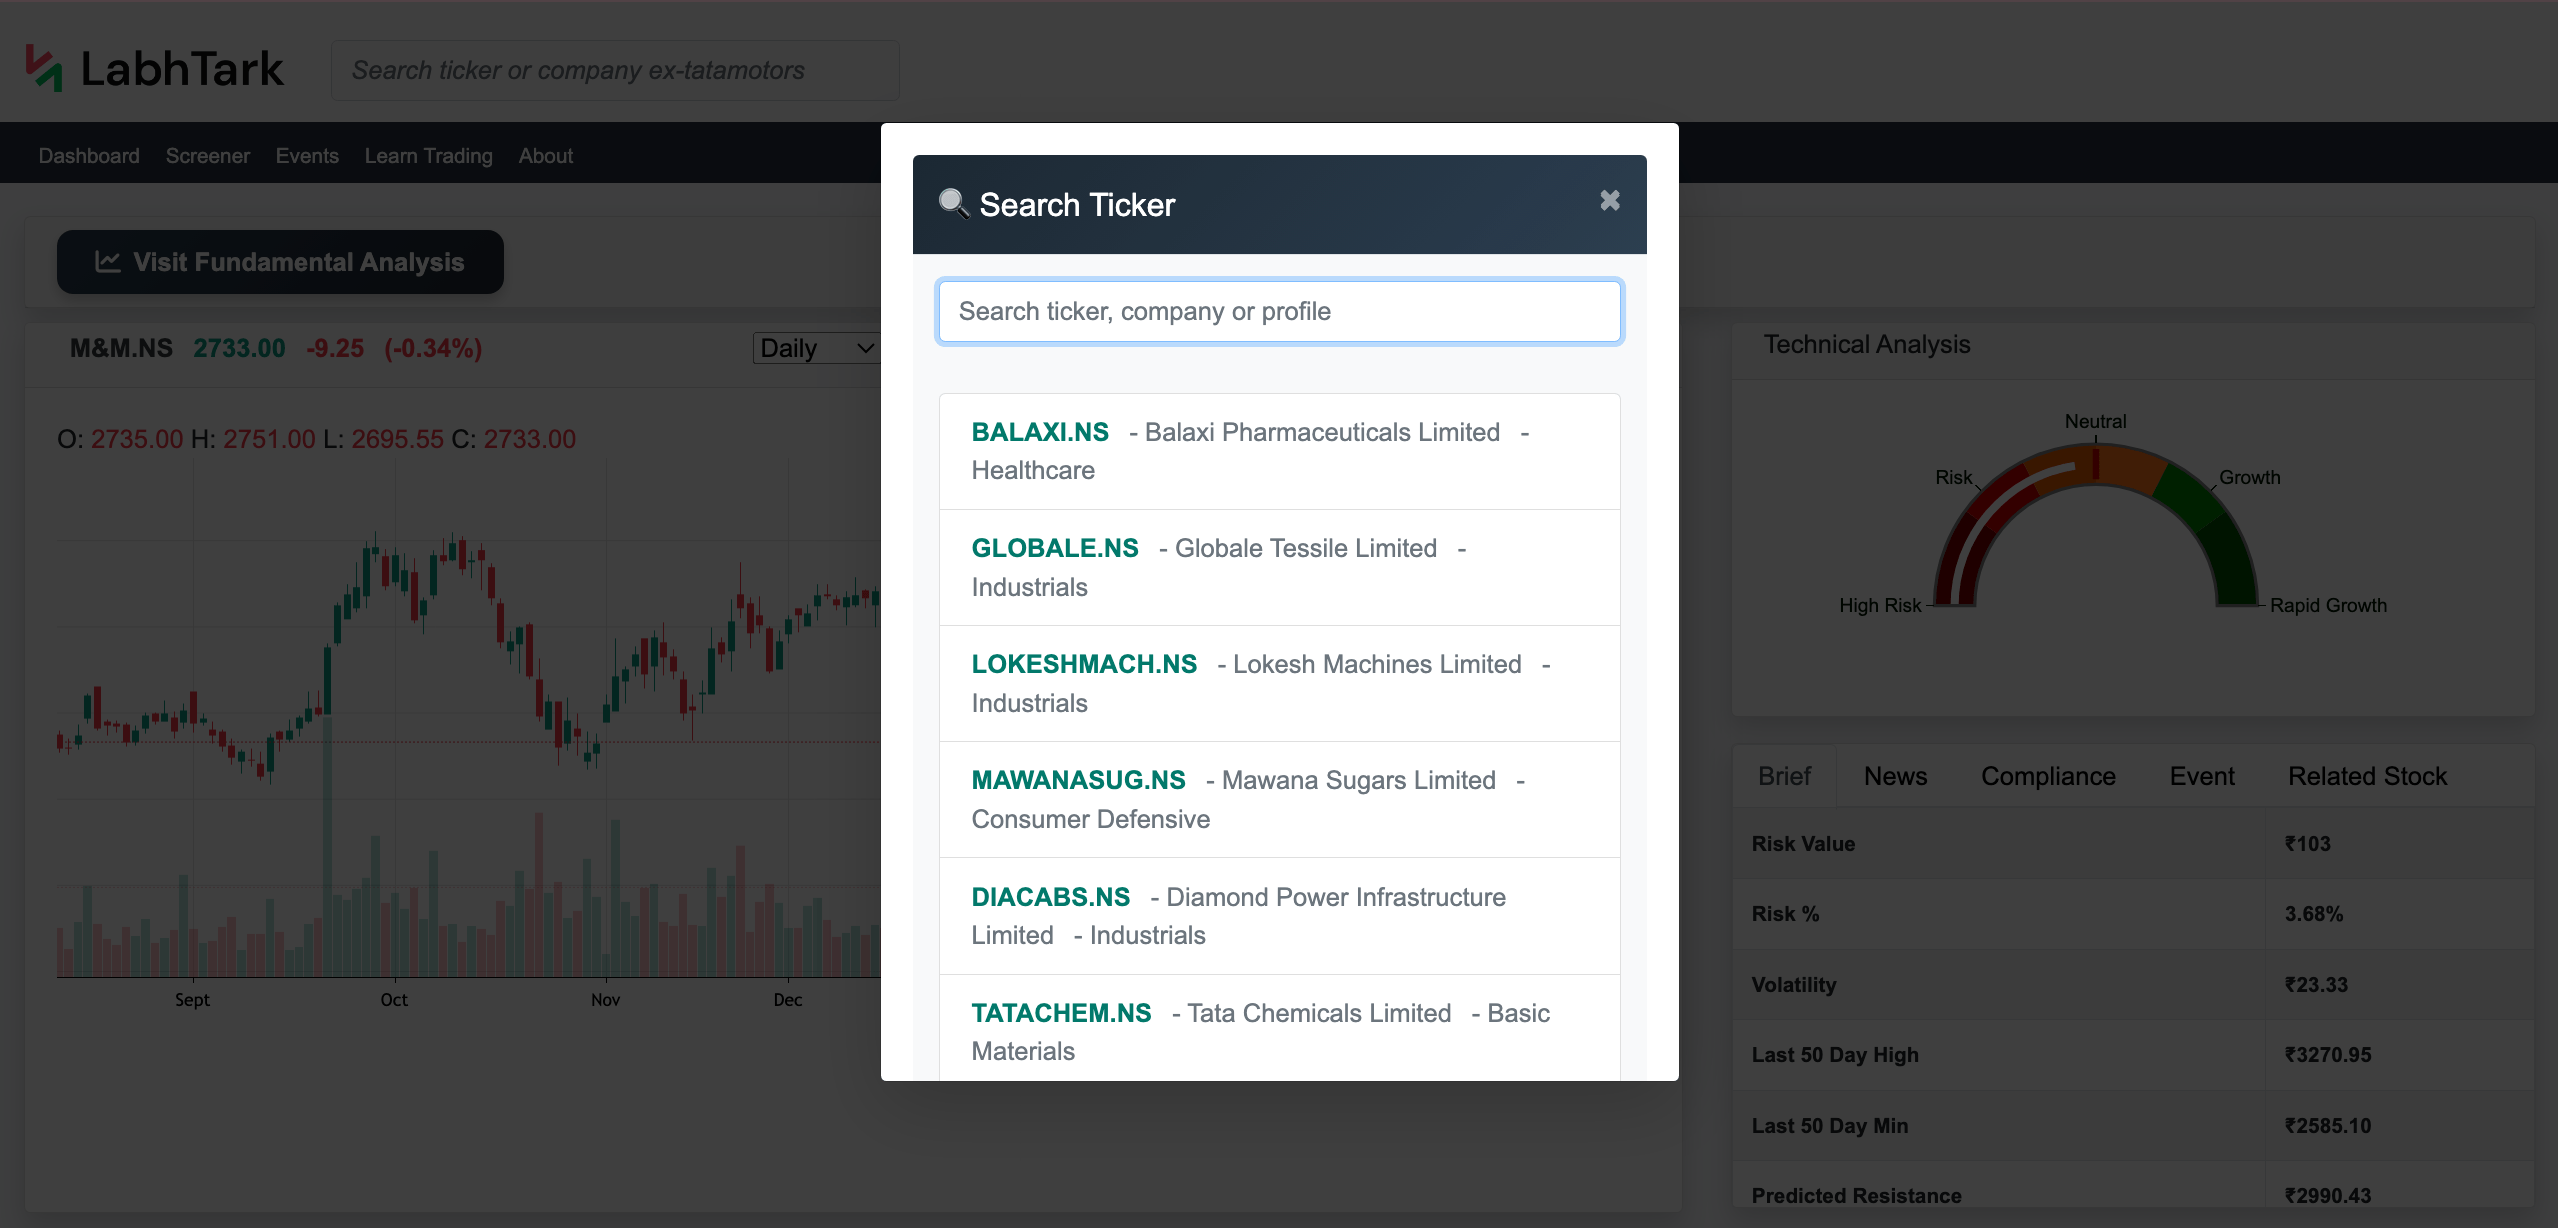
LabhTark provides a robust tool to perform stock technical analysis.
- Users need to search for the company or stock they want to analyze in the search bar, also they can search for Nifty50 or Sensex index for Nifty 50 technical analysis, and Sensex technical analysis
- Once the page is loaded, we have historical data with a candle chart in the left and in the right corner we have all the analysis.
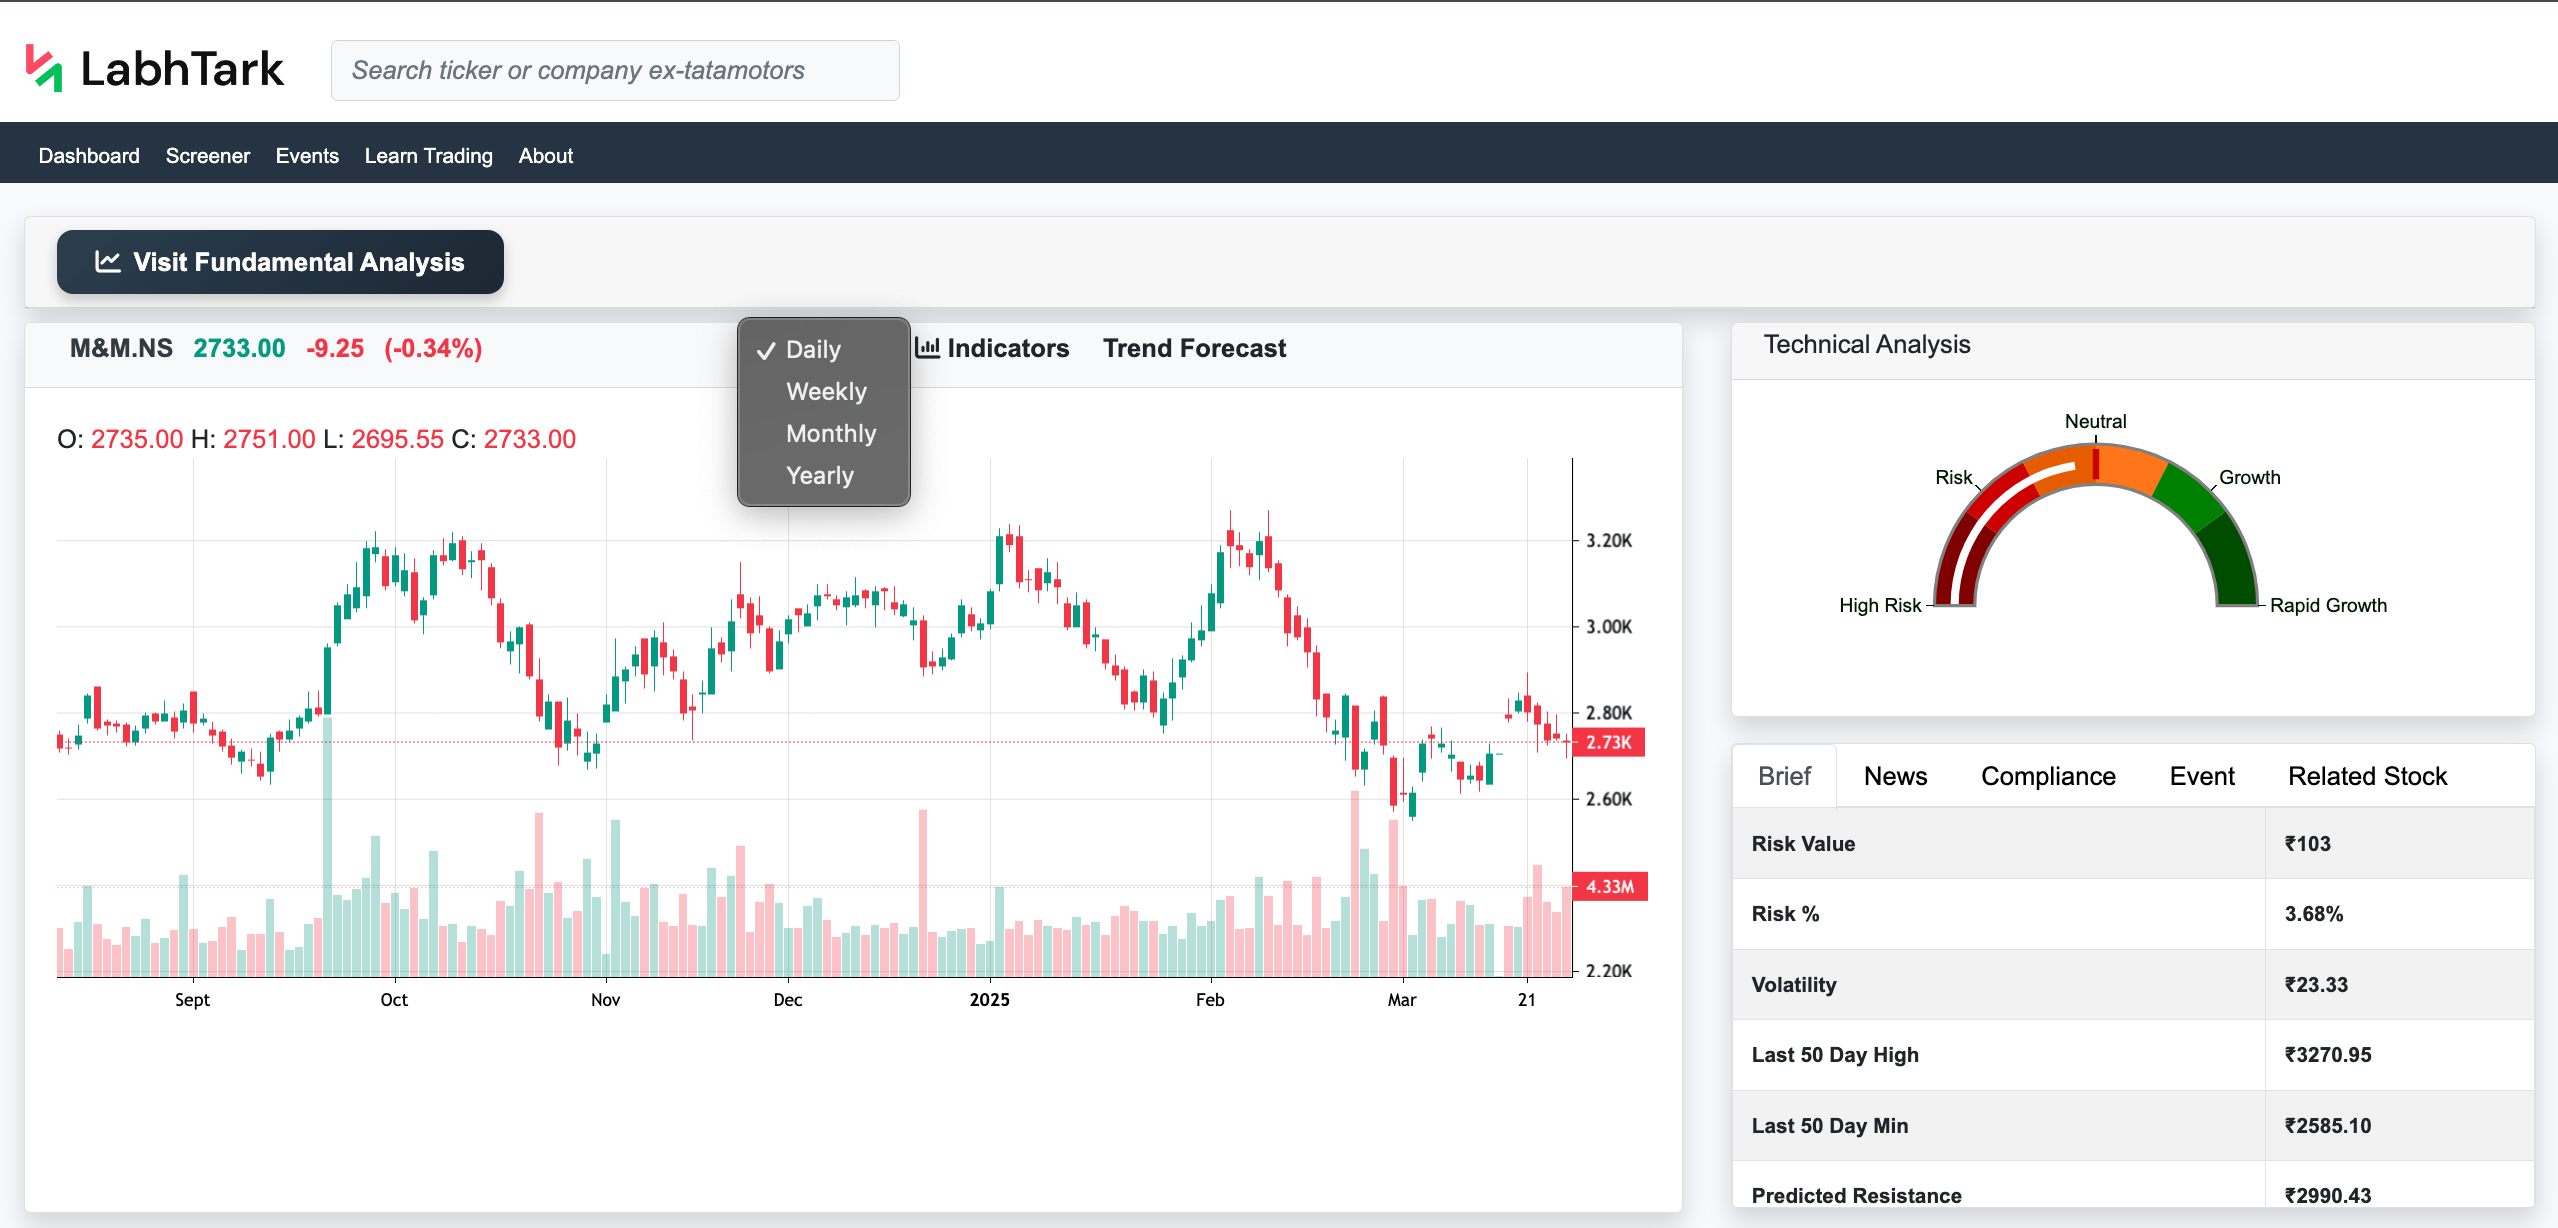
Features of Candle Charts
- In our candle chart of the stock, the user can determine the current closing price of the stock in the top, with change from previous value.
- Then the user can select the granularity of the chart, i.e., daily, weekly, monthly, or yearly.
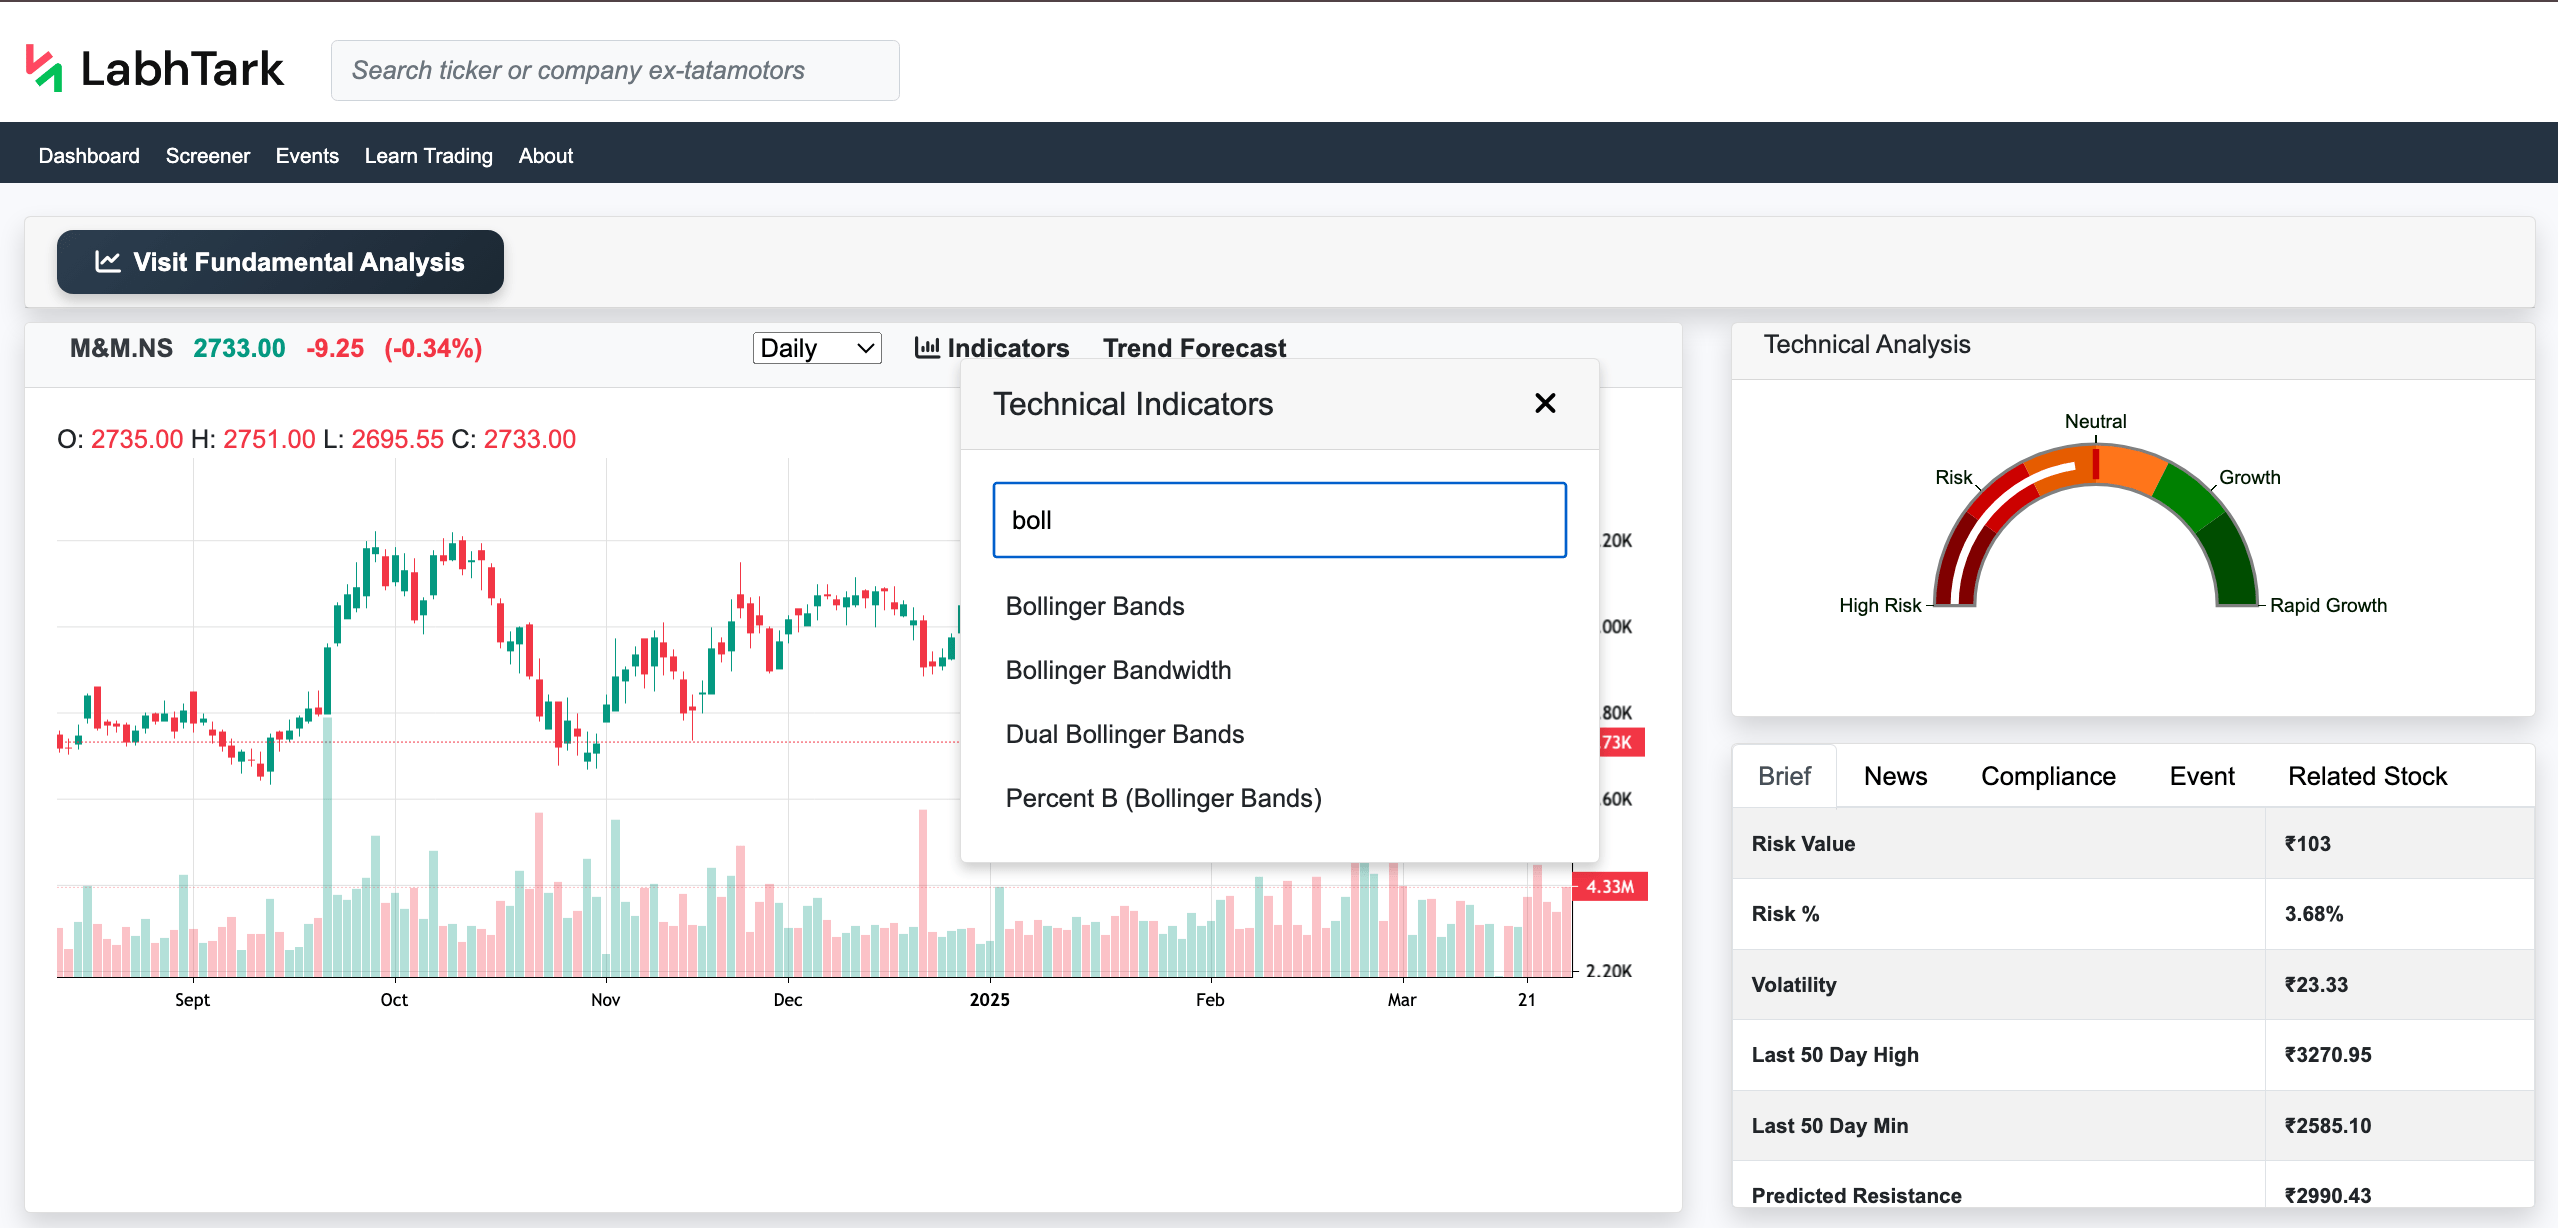
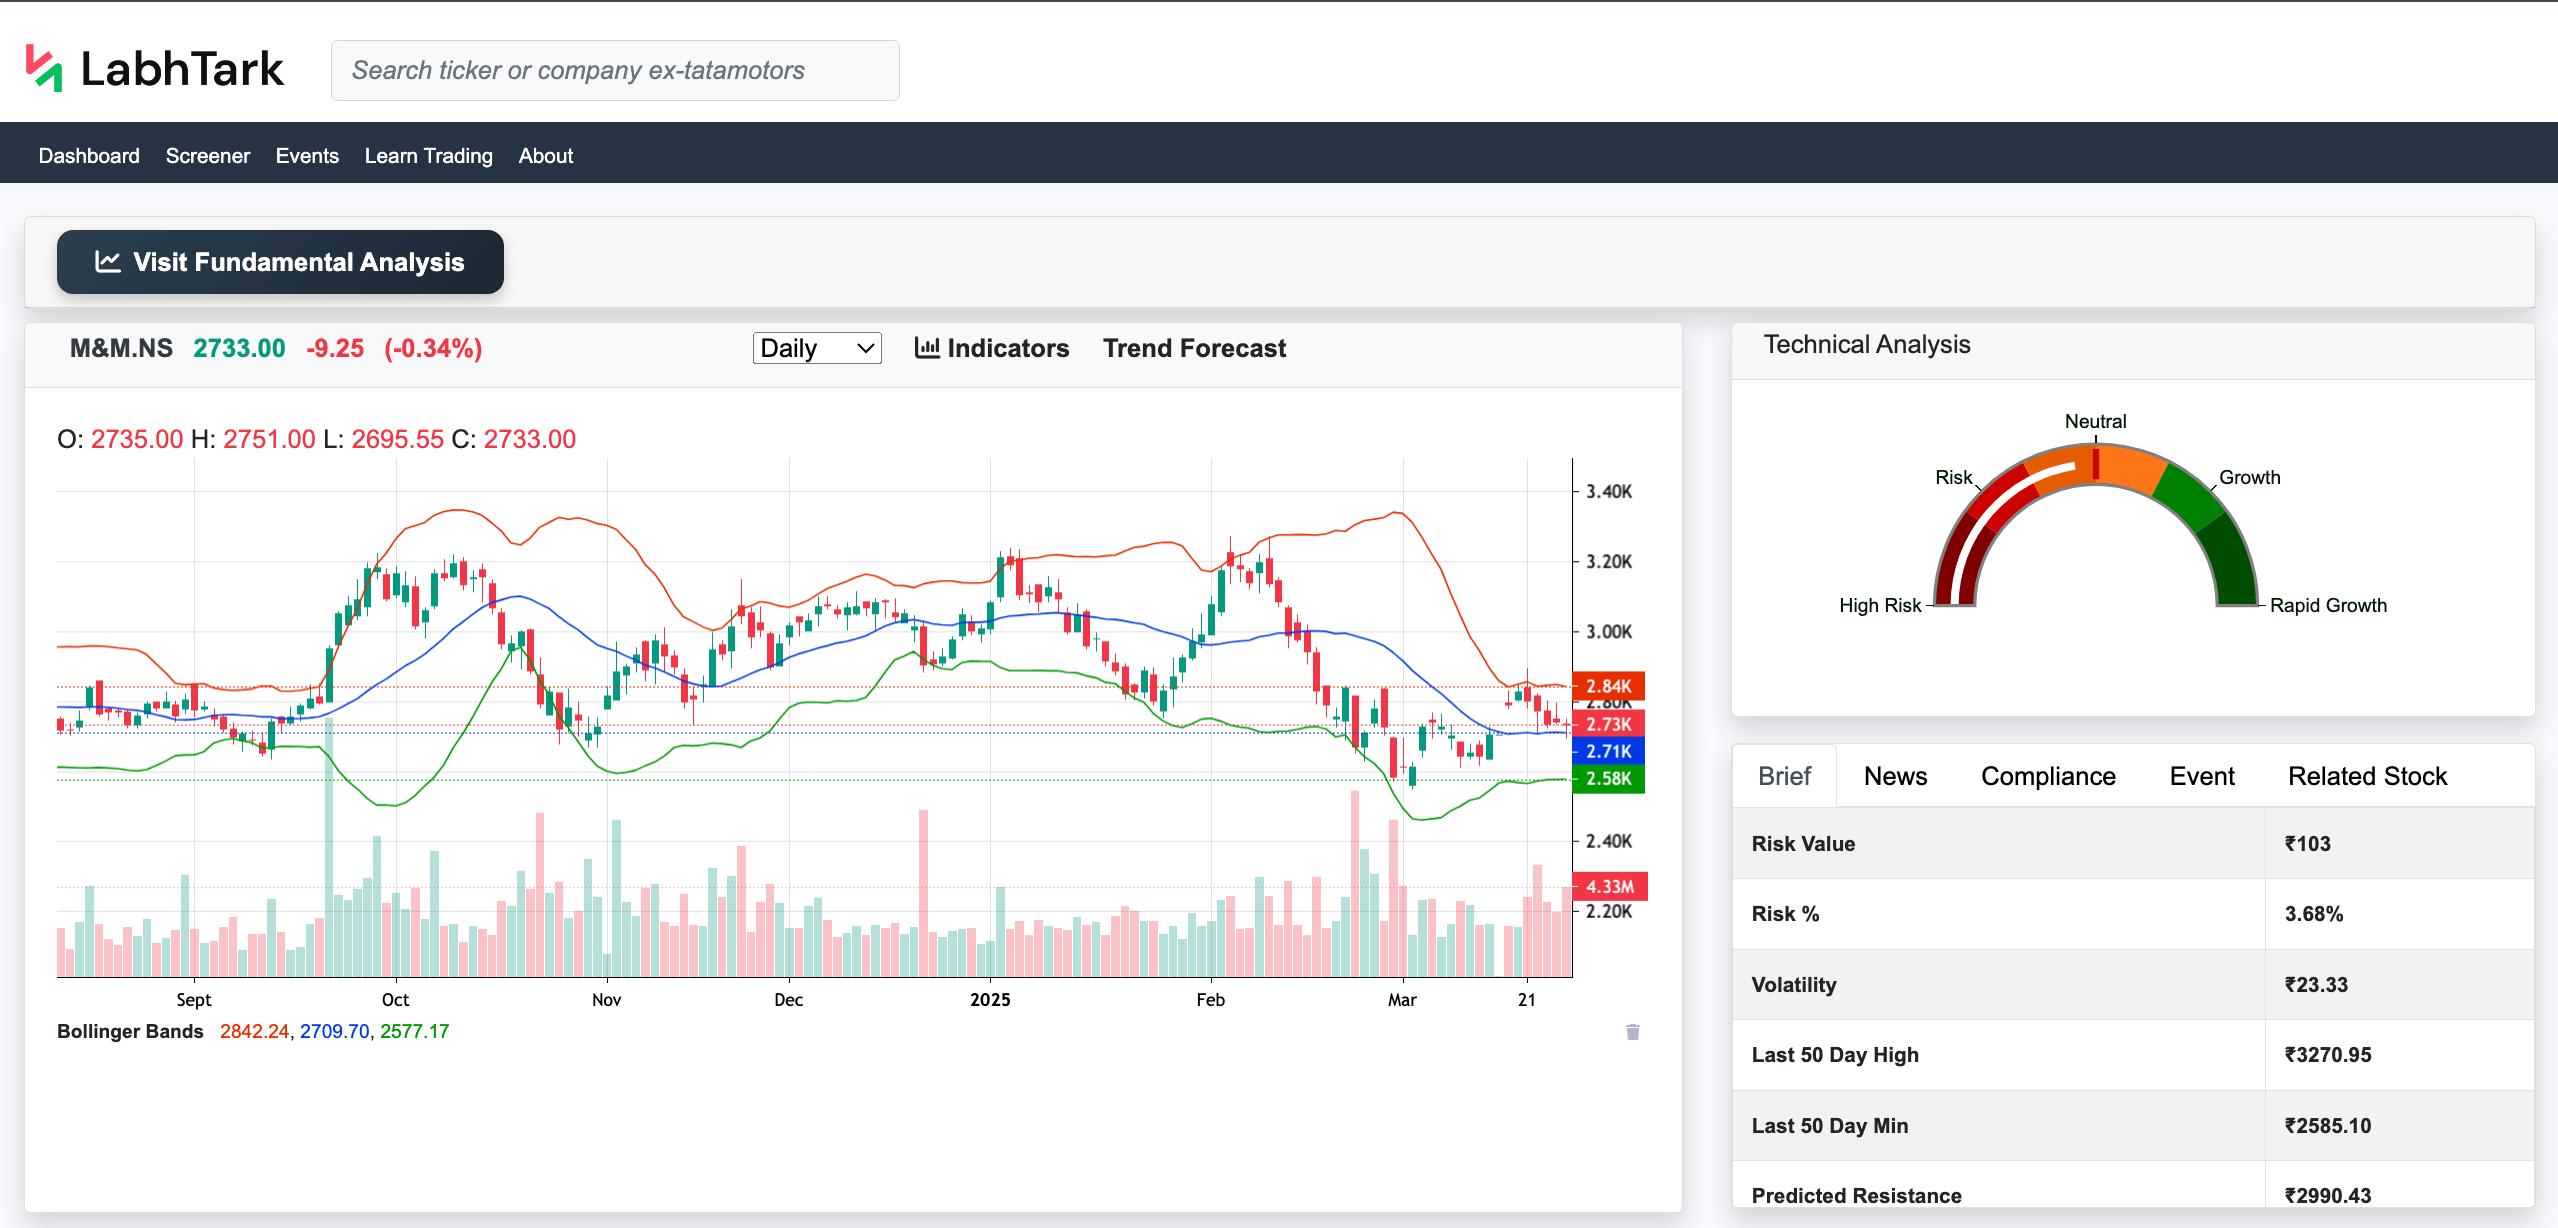
- Then the user can add a chart for indicators, like RSI, ATR, Bollinger Bands, and other more than 40 indicators, to learn how these indicators give insight for the stocks, visit the "Learn Trading" section of LabhTark and select Technical Indicators to learn it, or click the below link to reach it directly.
- Then the user can analyze the stock by scrolling the chart left and right to see full historical data.
Feature of Analysis
- In the top right, the user can get an overall insight into the stock from the gauge chart, which indicates if the stock is “High Risk," “Risk," “Neutral," “Growth,” or “Rapid Growth.”
- Next we have multiple tabs for a brief of the stock, news, compliance, events, and related stocks.
- In the “Brief” tab we have all the important data points in the tabular form, like the last 50 days high or the last 50 days min.
- In the “News” tab we have news related to this particular stock, latest stock market news India with sentiment analysis, where green represents positive news, red represents negative news, and grey represents neutral news.
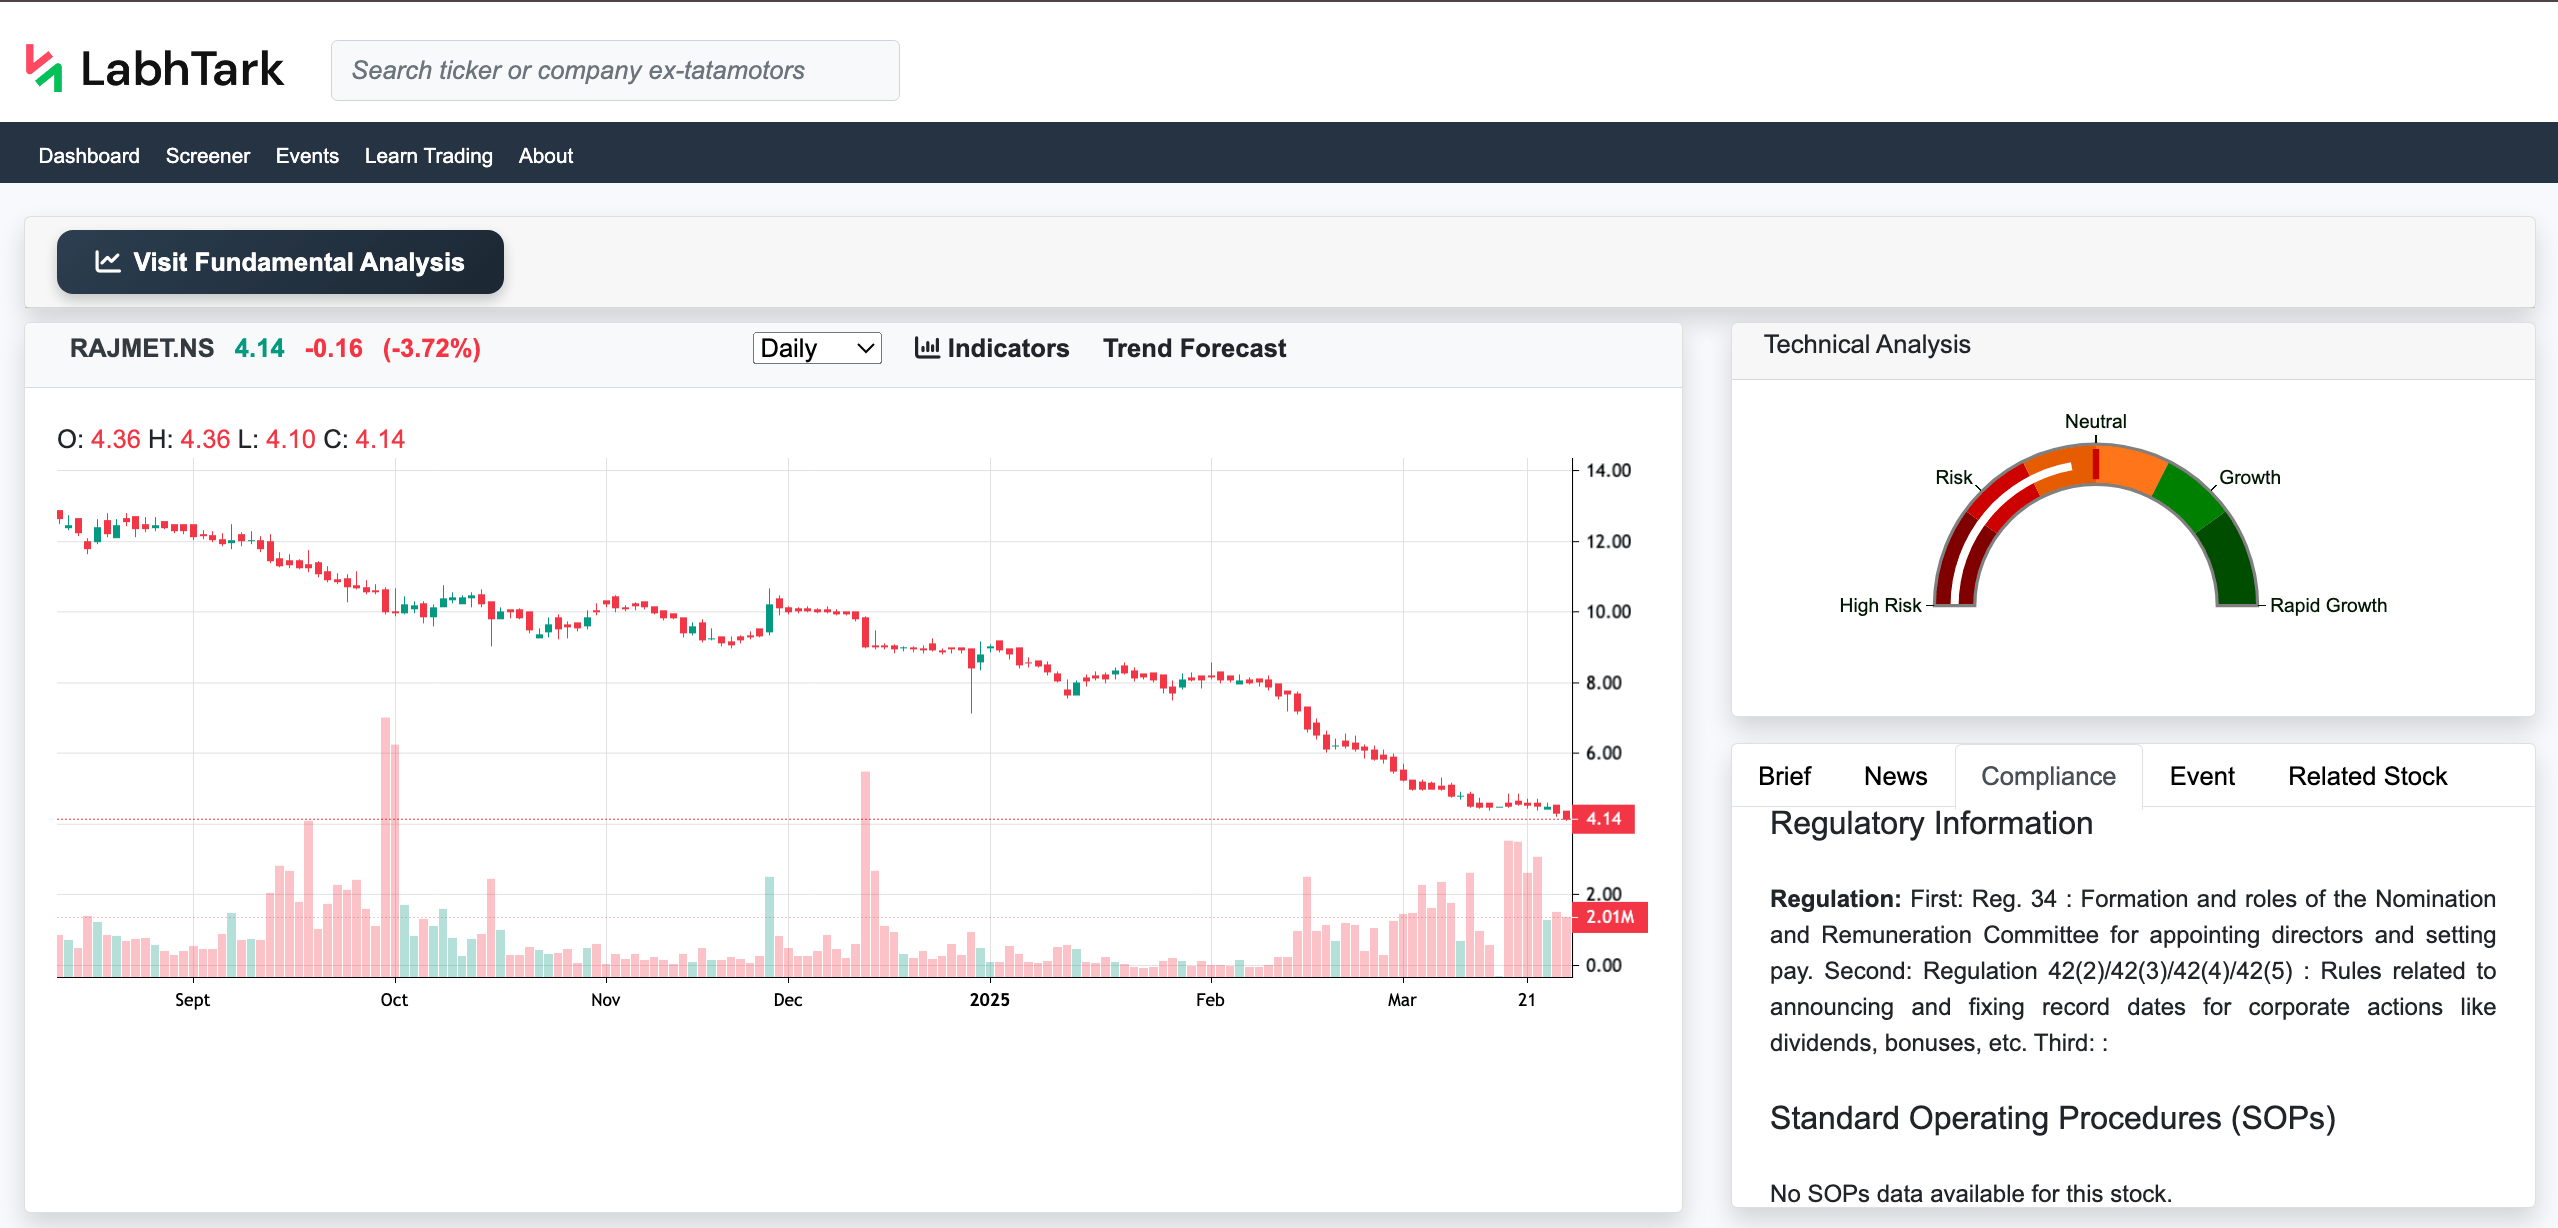
- In the “Compliance” tab we have data related to compliance for this particular stock, which informs whether the stock has any legal compliance going on currently, which makes it risky for the investment.
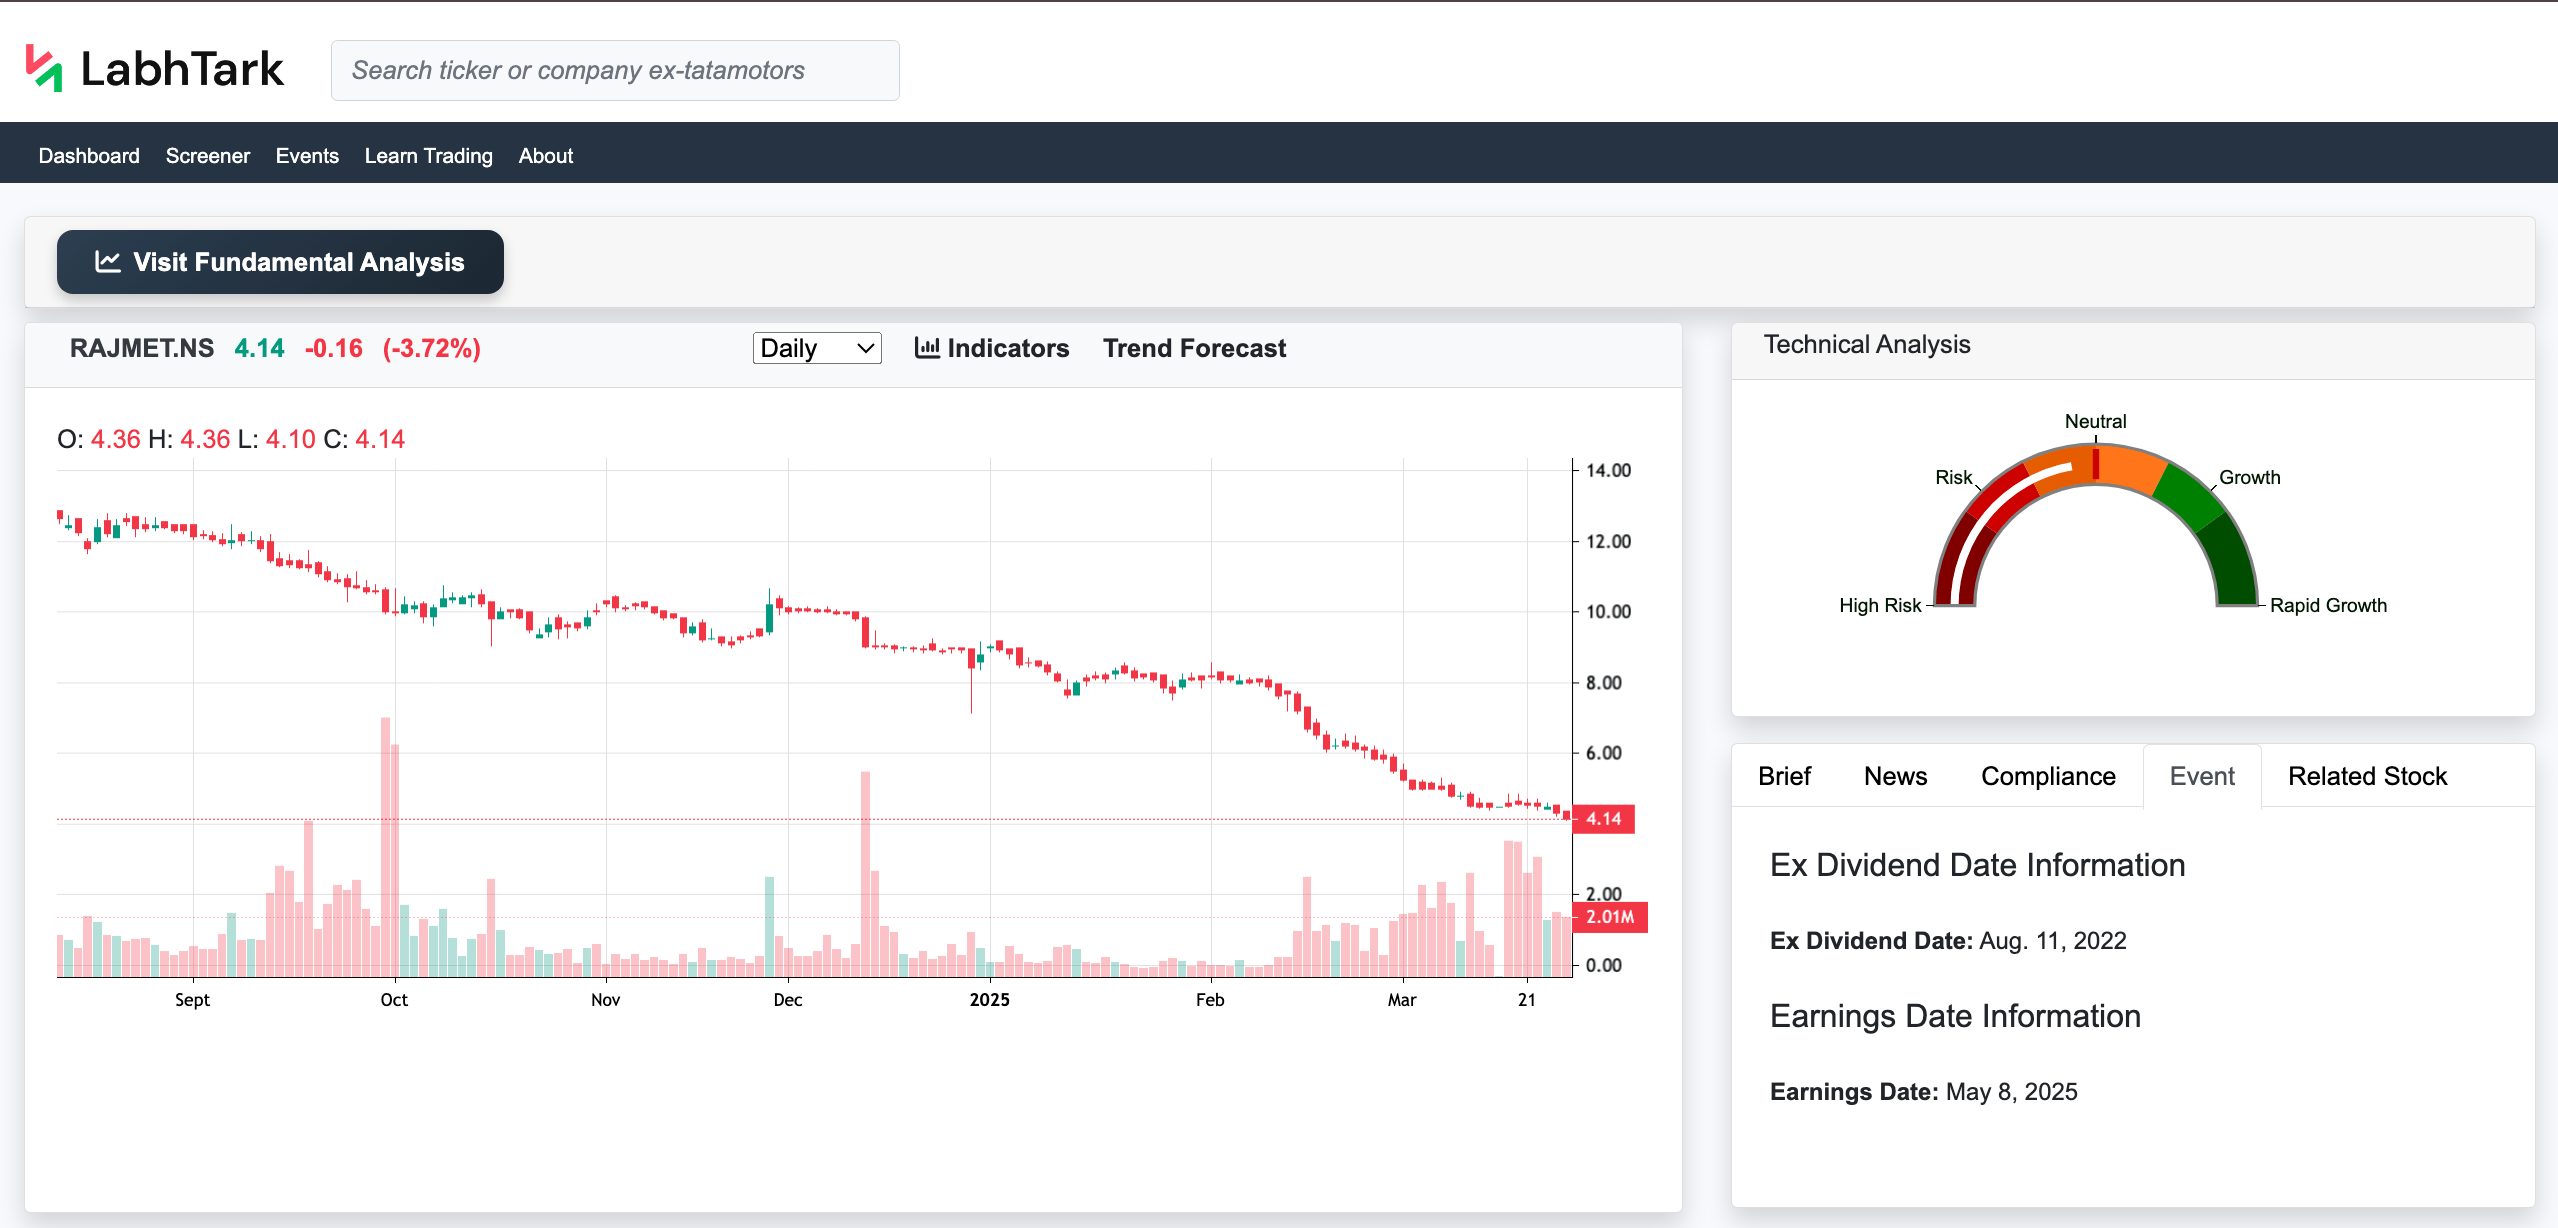
- In the “Events” tab we have important dates related to this particular stock, like ex-dividend dates for Dividend investing in Indian stocks and earnings date information, for Corporate earnings reports India
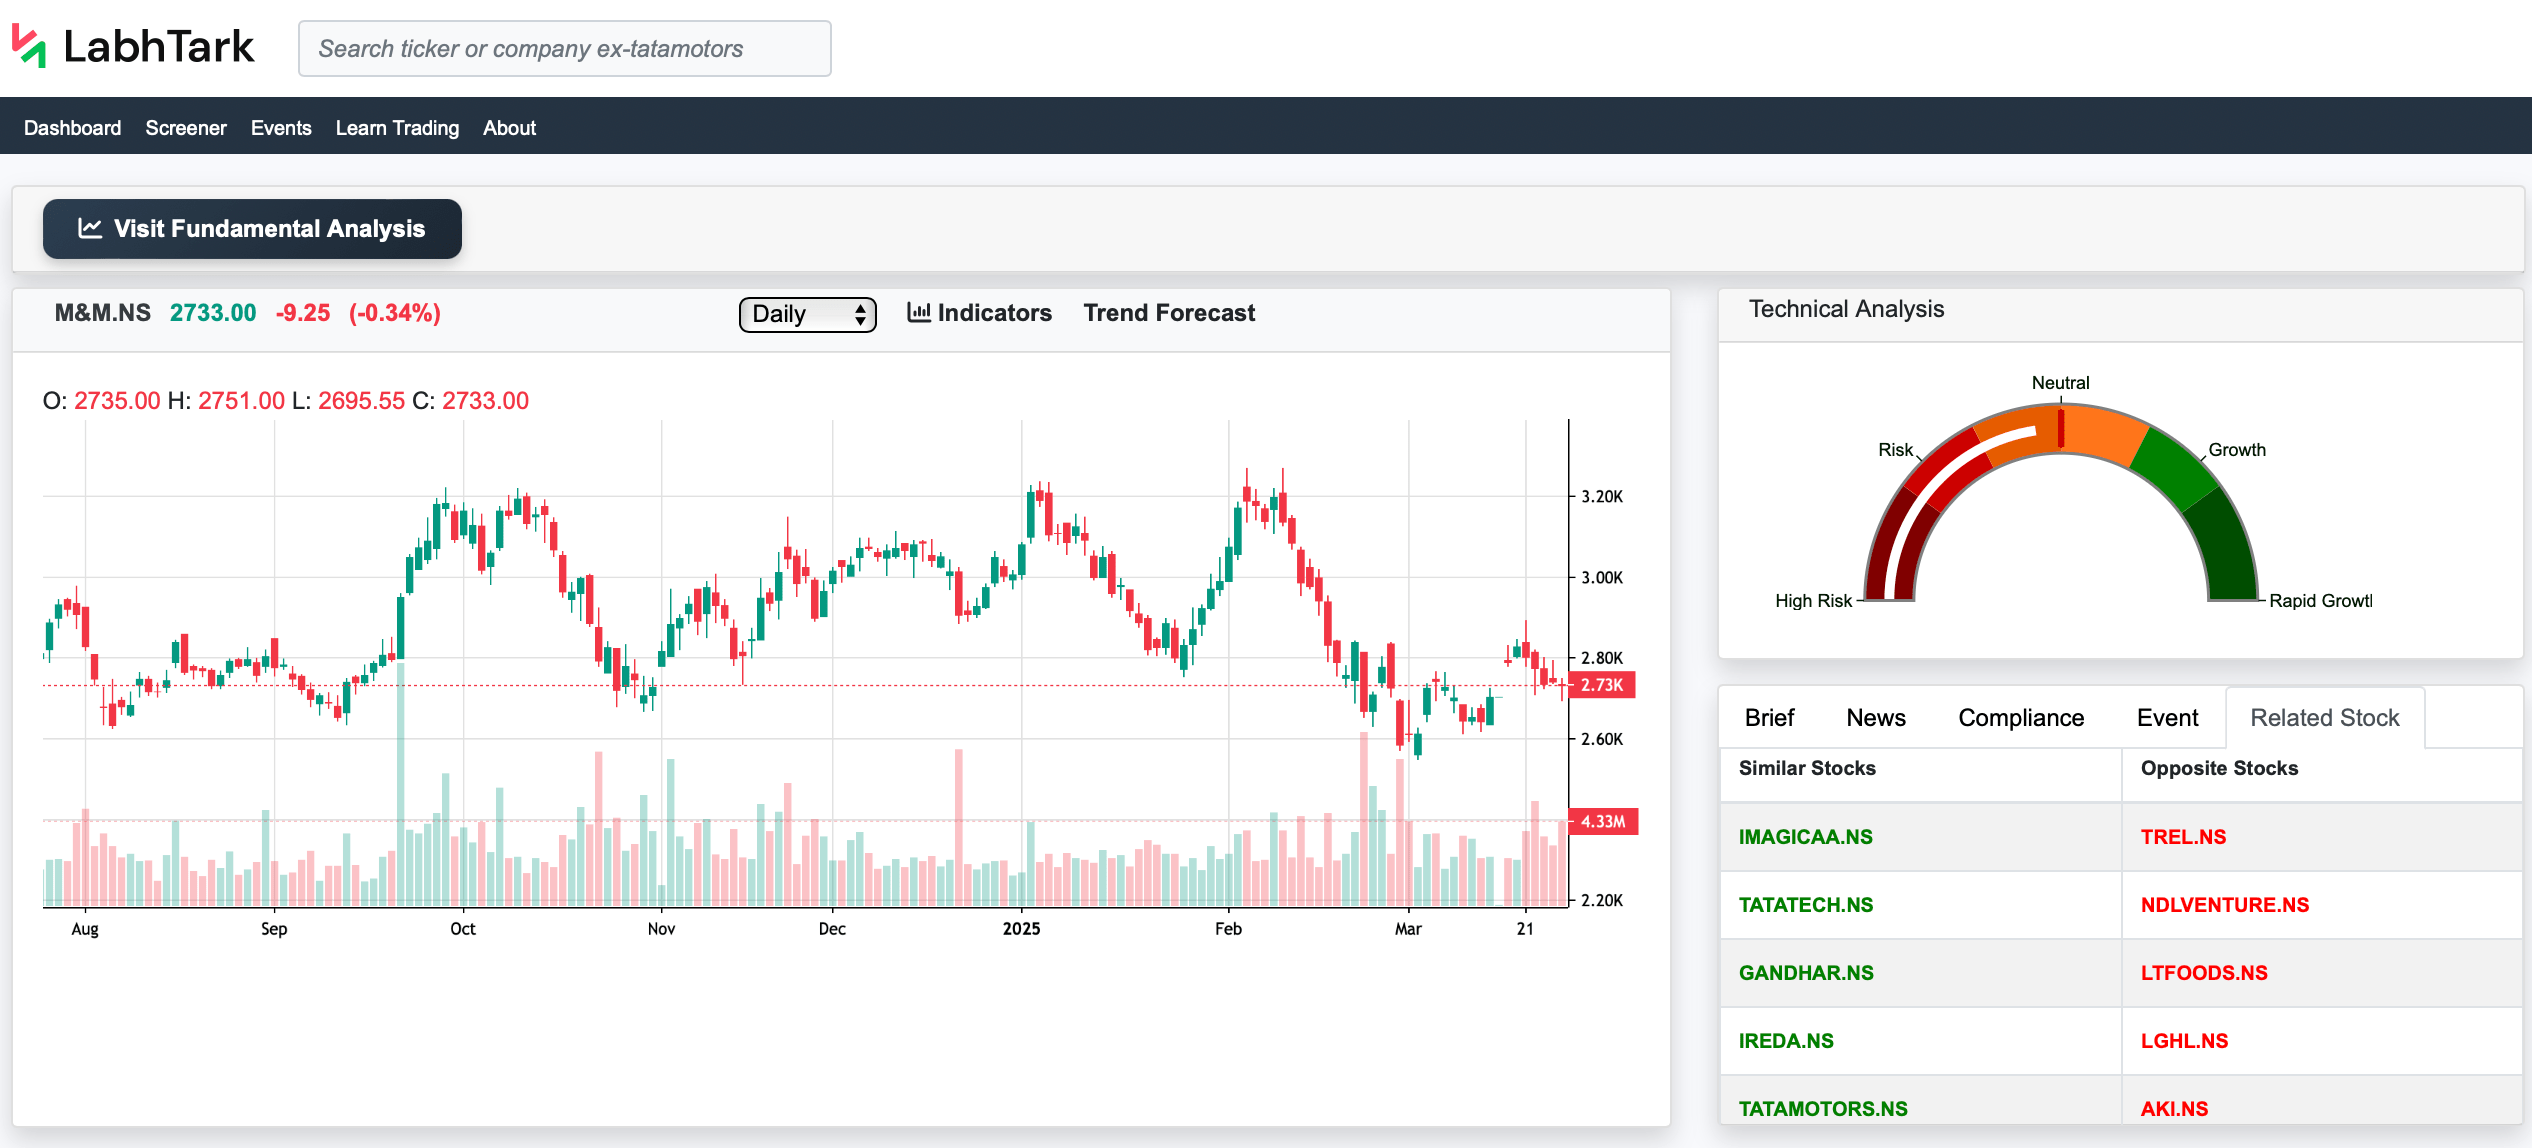
- In the “Related Stocks” tab we have a list of stocks that are either similar to this stock or opposite.
4. How to perform technical analysis and Candlestick chart analysis
Technical analysis may sound complicated, but it has four basic parts to predict the future value of a stock’s price and guide to stock chart patterns using technical indicators for stocks.
1. Trend Indicators
This determines what the current trend (uptrend, downtrend, or sideways trend) of the stock is; below are some examples of indicators for this.
- EMA (Exponential Moving Average)
- Adaptive Moving Average (AMA)
2. Momentum Indicators
This determines whether stock is overbought or underbought so that traders can decide whether to buy or sell this stock; below are some examples of indicators for this.
- Relative Strength Indicator (RSI)
- Stochastic Oscillator
3. Volatility Indicators
This determines how far stock can move up or down in the coming future, basically the volatility of the stock; below are some examples of indicators for this.
- Average True Range (ATR)
- Bollinger Bands
4. Volume Indicators
This determines how stock is performing according to its volume; below are some examples of indicators for this.
- Volume weighted average (VWAP)
- On-Balance Volume (OBV)