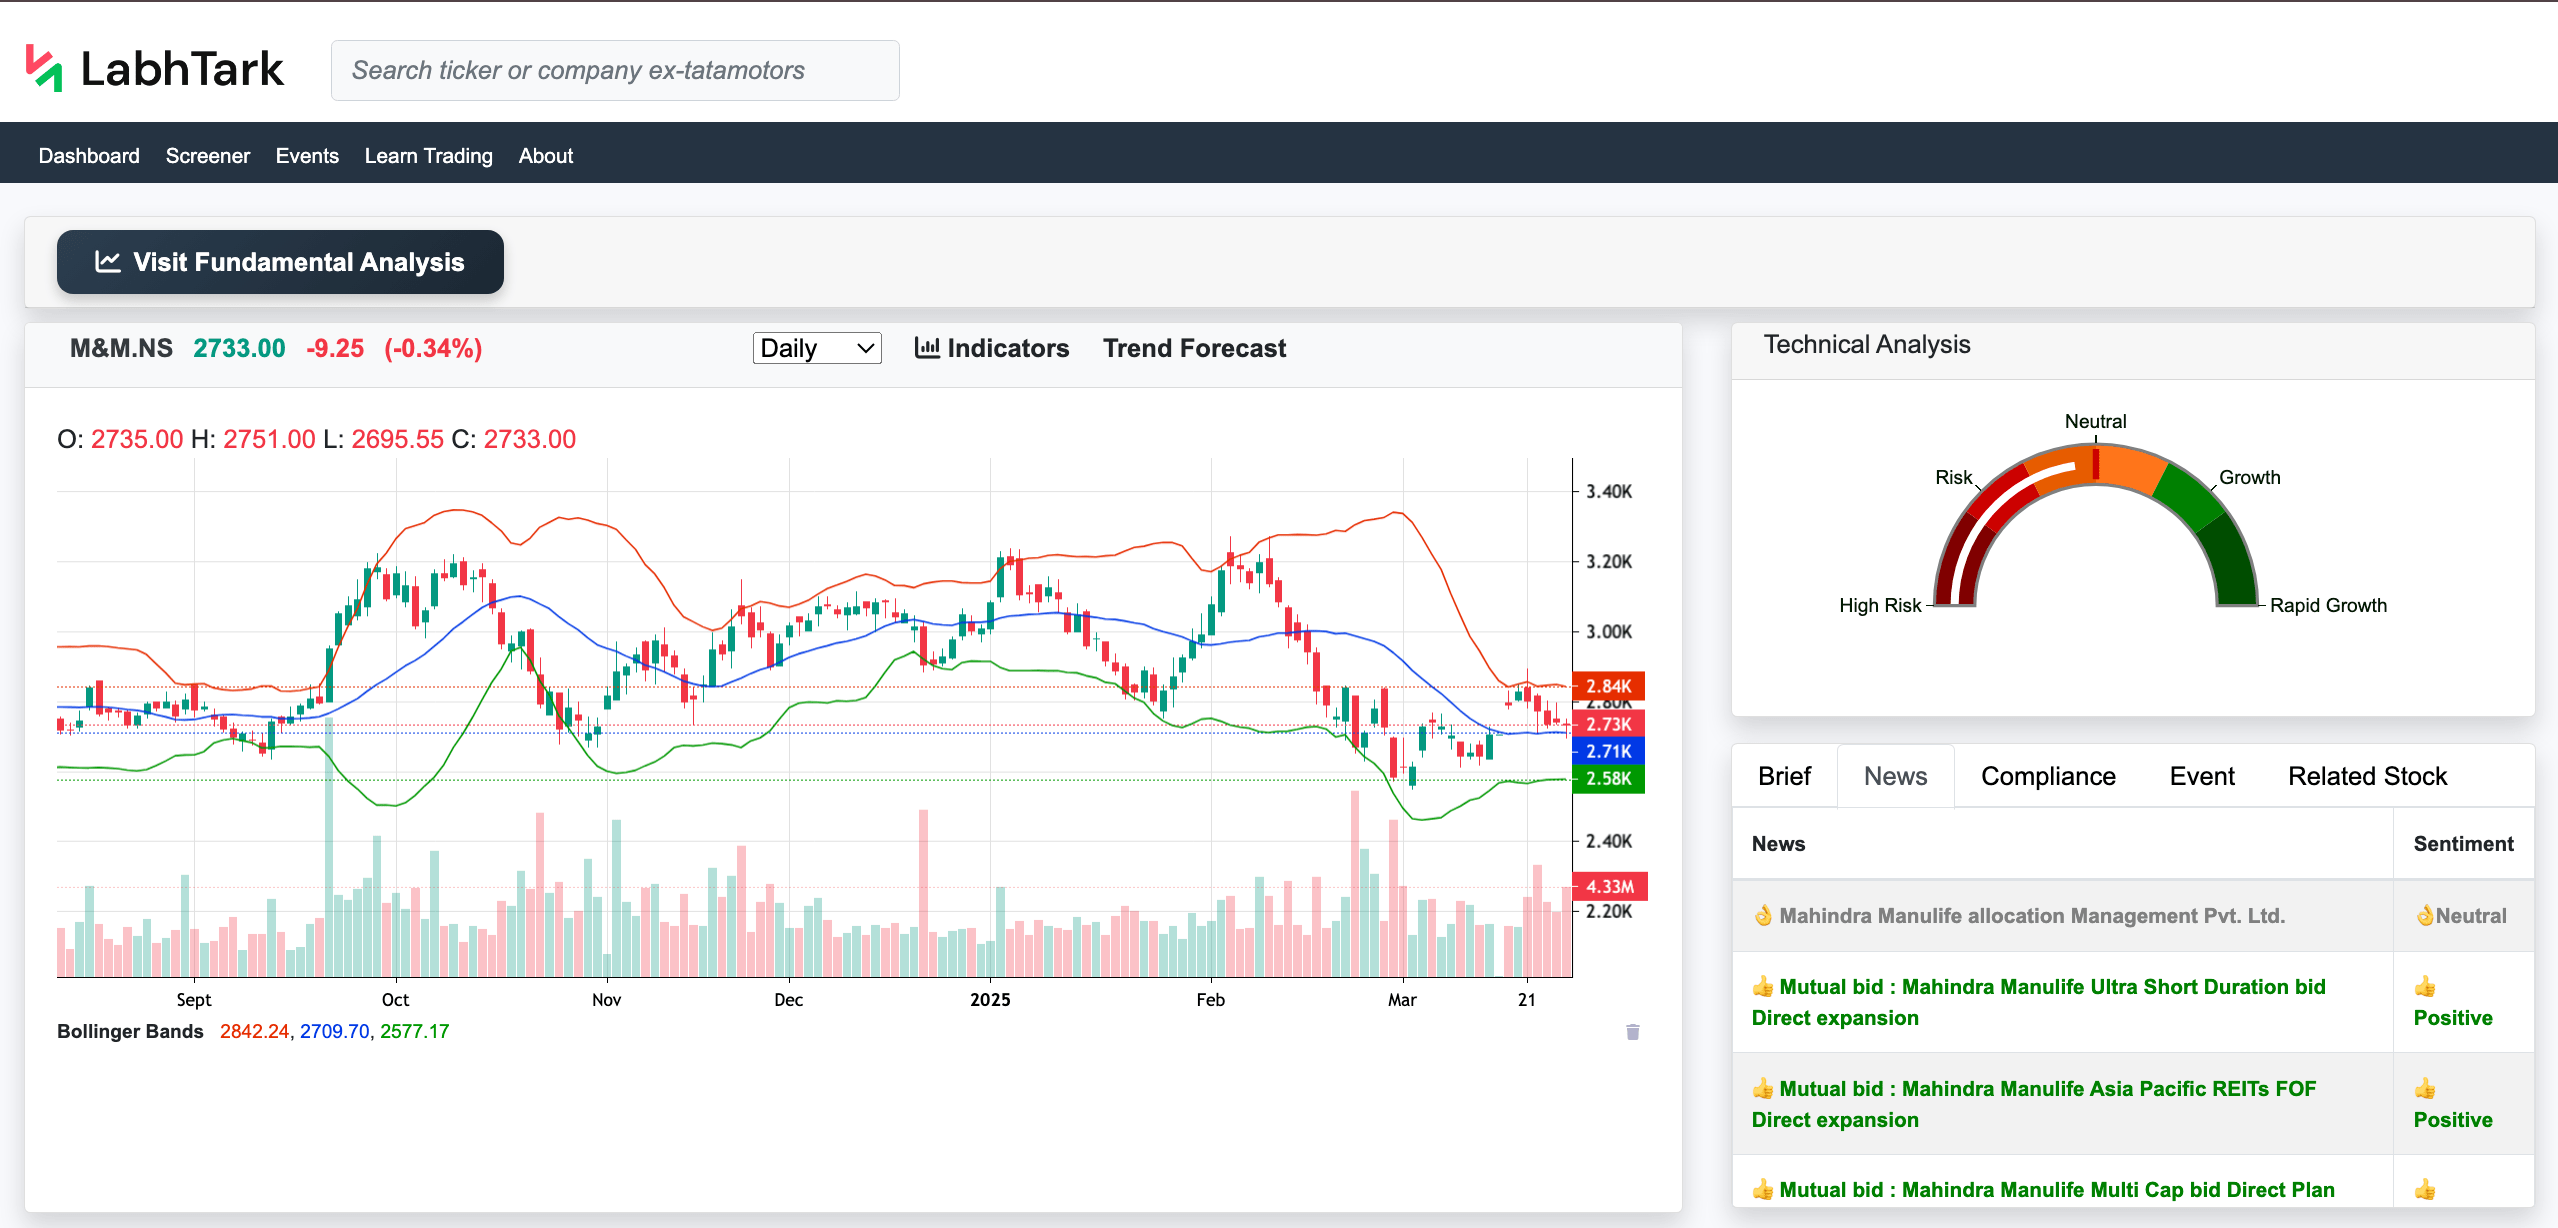
Technical Analysis
Risk Value | ₹1270 |
---|---|
Risk % | 1.69% |
Volatility | ₹333.17 |
Last 50 Day High | ₹78741.69 |
Last 50 Day Min | ₹72989.93 |
Predicted Resistance | ₹75622.63 |
Predicted Floor | ₹73887.68 |
News | Sentiment |
---|---|
exchange Guru With Daljeet Kohli On Tariff War, Crude Oil, And Rupee Fall Impact On Nifty & Sensex | Negative |
Mutual bid : UTI S&P BSE Sensex benchmark bid Direct expansion | Positive |
Mutual bid : LIC MF S & P BSE Sensex benchmark Direct Plan expansion choice | Positive |
Mutual bid : Nippon India benchmark S&P BSE bid Sensex Plan - Direct Plan - expansion Plan | Positive |
Mutual bid : SBI S&P BSE Sensex benchmark bid Direct expansion | Positive |
Mutual bid : Tata S&P BSE Sensex benchmark bid Direct Plan | Positive |
Mutual bid : ICICI Prudential S&P BSE Sensex benchmark bid Direct expansion | Positive |
Sensex, Nifty: Why security exchange looks set for strong rally; sectors to watch | Positive |
S&P BSE SENSEX 50 benchmark | Neutral |
Mutual bid : HDFC benchmark S&P bid Sensex Plan-Direct Plan | Neutral |
India Bucks pattern As Asia Falls: Nifty Soars 400 Points, Sensex Jumps 1,300 Points | Neutral |
Bulls back on D-Street: Sensex increased 1,300 pts, Nifty above 22,800 mark | Neutral |
ownership MF inflows fall 14% in March despite exchange rebound; sectoral funds see steep drop | Neutral |
Sensex, Nifty: Investor wealth reclaims Rs 400-lakh cr mark amid 90-day pause on Trump tariffs | Neutral |
security exchange today: Gift Nifty rise 447 points; key levels for Nifty, Sensex & Nifty Bank | Neutral |
Sensex, Nifty to see rise to 5% gap rise on Friday? What's in for D-St as Trump pauses tariffs | Neutral |
No compliance data available for this stock.
Please check back later for updated information.
No Event data available for this stock.
Please check back later for updated information.
Summary
What is the sentiment of Sensex stock? (^BSESN)
Above is the sentiment of Sensex stock and summary for the technical analysis. whose ticker name is ^BSESN and belongs to sector Index, and it is listed in BSE (Bombay Stock Exchange).
The Sensex has a current value in BSE (Bombay Stock Exchange) of , and the Sensex, whose ticker name is ^BSESN, has changed from the previous closing value.
The ^BSESN, which is Sensex, has a risk value of ₹1270, volatility of ₹333.17, and the ^BSESN has a last 50 days high value of ₹78741.69, ^BSESN and a last 50 days min value of ₹72989.93.
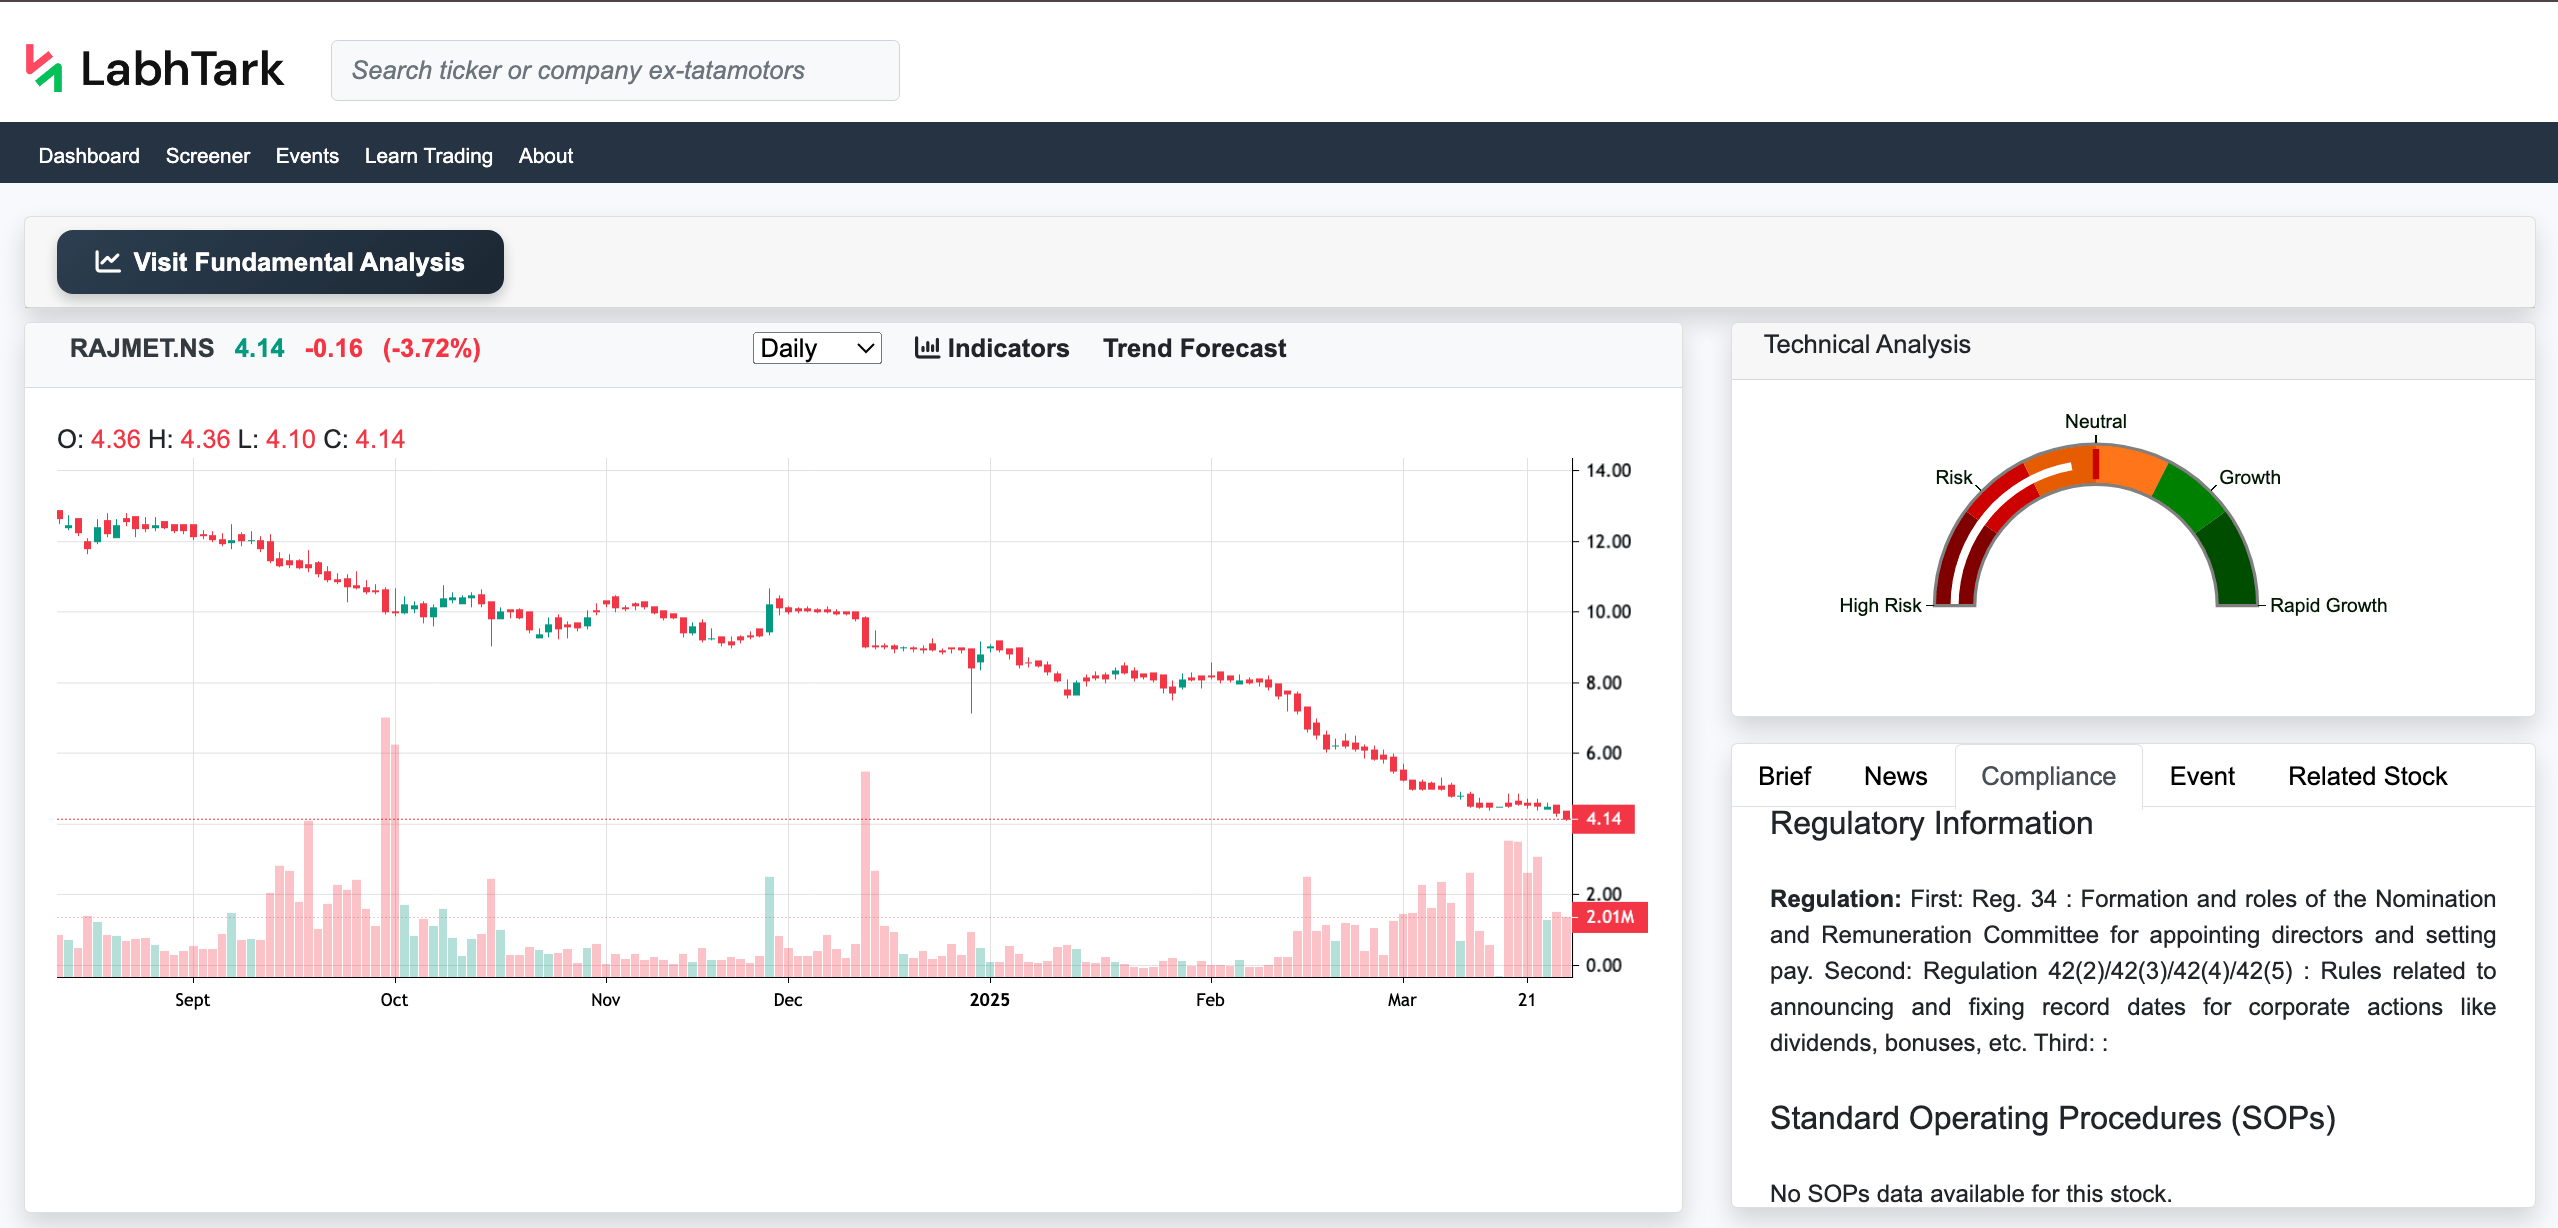
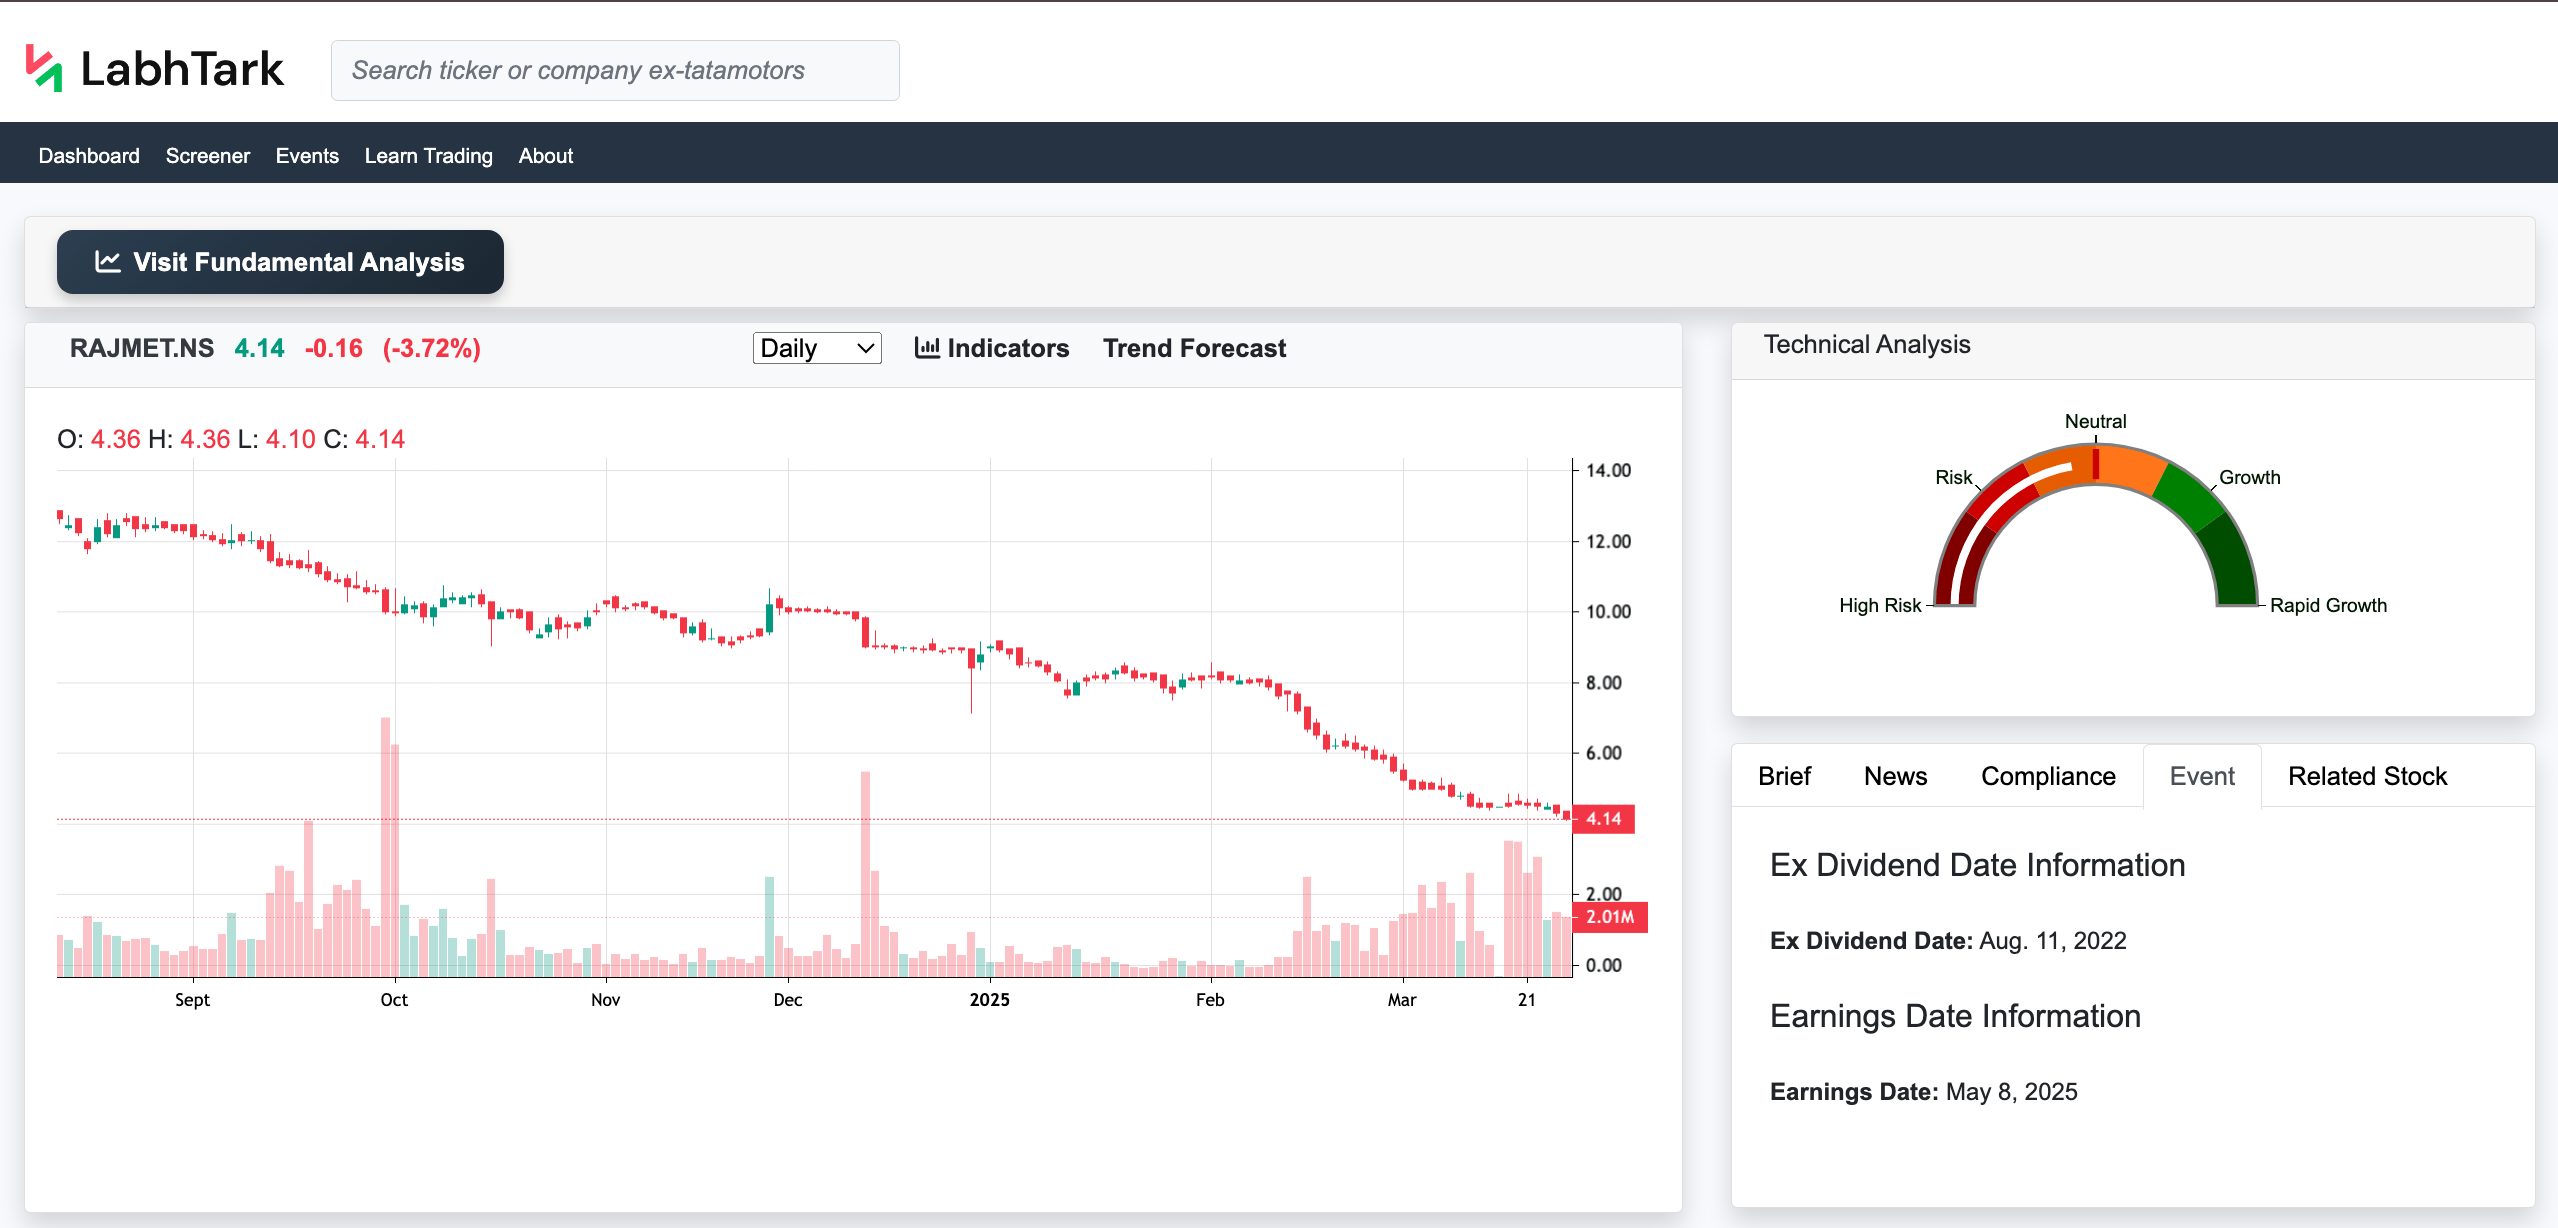
And the company has the following upcoming events:
No Event data available for this stock.
Please check back later for updated information.
1. What is Technical Analysis and Nifty 50 analysis
Technical analysis helps traders and investors to determine the current trend (uptrend, downtrend, or sideways trend), seasonality, patterns in the chart of the stock, and whether the stock is overbought or oversold to ultimately predict whether the stock will go up or down in the future.
Basically, traders use historical stock prices, including ("Open," "Close, High," "Low") to drive various insights for the stock, and it also involves using technical indicators, which are nothing but mathematically calculated values using stock historical prices to generate more insights.
Also, there are various patterns that are formed in the chart of historical data of stock, which also conveys some insights about how stock is going to perform in the future.
For more details, visit the below link to learn how to perform technical analysis:
Technical Analysis2. Importance of Technical Analysis
While technical analysis does not incorporate any financial data of a company’s business still, technical analysis gives good insight about how stock will perform mostly for the Short-term trading strategies.
As the price of stock tends to follow trend and seasonality, it becomes important to perform technical analysis to find out the current trend (uptrend, downtrend, or sideways trend), seasonality, patterns in the chart of the stock, and whether the stock is overbought or oversold so that traders can predict where the stock can go in the current scenario, also helps with Nifty 50 analysis which is Indian stock market indices
3. How to Use Our Tool
LabhTark provides a robust tool to perform stock technical analysis.
- Users need to search for the company or stock they want to analyze in the search bar, also they can search for Nifty50 or Sensex index for Nifty 50 technical analysis, and Sensex technical analysis
- Once the page is loaded, we have historical data with a candle chart in the left and in the right corner we have all the analysis.

Features of Candle Charts
- In our candle chart of the stock, the user can determine the current closing price of the stock in the top, with change from previous value.
- Then the user can select the granularity of the chart, i.e., daily, weekly, monthly, or yearly.
- Then the user can add a chart for indicators, like RSI, ATR, Bollinger Bands, and other more than 40 indicators, to learn how these indicators give insight for the stocks, visit the "Learn Trading" section of LabhTark and select Technical Indicators to learn it, or click the below link to reach it directly.
- Then the user can analyze the stock by scrolling the chart left and right to see full historical data.


Feature of Analysis
- In the top right, the user can get an overall insight into the stock from the gauge chart, which indicates if the stock is “High Risk," “Risk," “Neutral," “Growth,” or “Rapid Growth.”
- Next we have multiple tabs for a brief of the stock, news, compliance, events, and related stocks.
- In the “Brief” tab we have all the important data points in the tabular form, like the last 50 days high or the last 50 days min.
- In the “News” tab we have news related to this particular stock, latest stock market news India with sentiment analysis, where green represents positive news, red represents negative news, and grey represents neutral news.
- In the “Compliance” tab we have data related to compliance for this particular stock, which informs whether the stock has any legal compliance going on currently, which makes it risky for the investment.
- In the “Events” tab we have important dates related to this particular stock, like ex-dividend dates for Dividend investing in Indian stocks and earnings date information, for Corporate earnings reports India
- In the “Related Stocks” tab we have a list of stocks that are either similar to this stock or opposite.


4. How to perform technical analysis
Technical analysis may sound complicated, but it has four basic parts to predict the future value of a stock’s price and guide to stock chart patterns
1. Trend Indicators
This determines what the current trend (uptrend, downtrend, or sideways trend) of the stock is; below are some examples of indicators for this.
- EMA (Exponential Moving Average)
- Adaptive Moving Average (AMA)
2. Momentum Indicators
This determines whether stock is overbought or underbought so that traders can decide whether to buy or sell this stock; below are some examples of indicators for this.
- Relative Strength Indicator (RSI)
- Stochastic Oscillator
3. Volatility Indicators
This determines how far stock can move up or down in the coming future, basically the volatility of the stock; below are some examples of indicators for this.
- Average True Range (ATR)
- Bollinger Bands
4. Volume Indicators
This determines how stock is performing according to its volume; below are some examples of indicators for this.
- Volume weighted average (VWAP)
- On-Balance Volume (OBV)