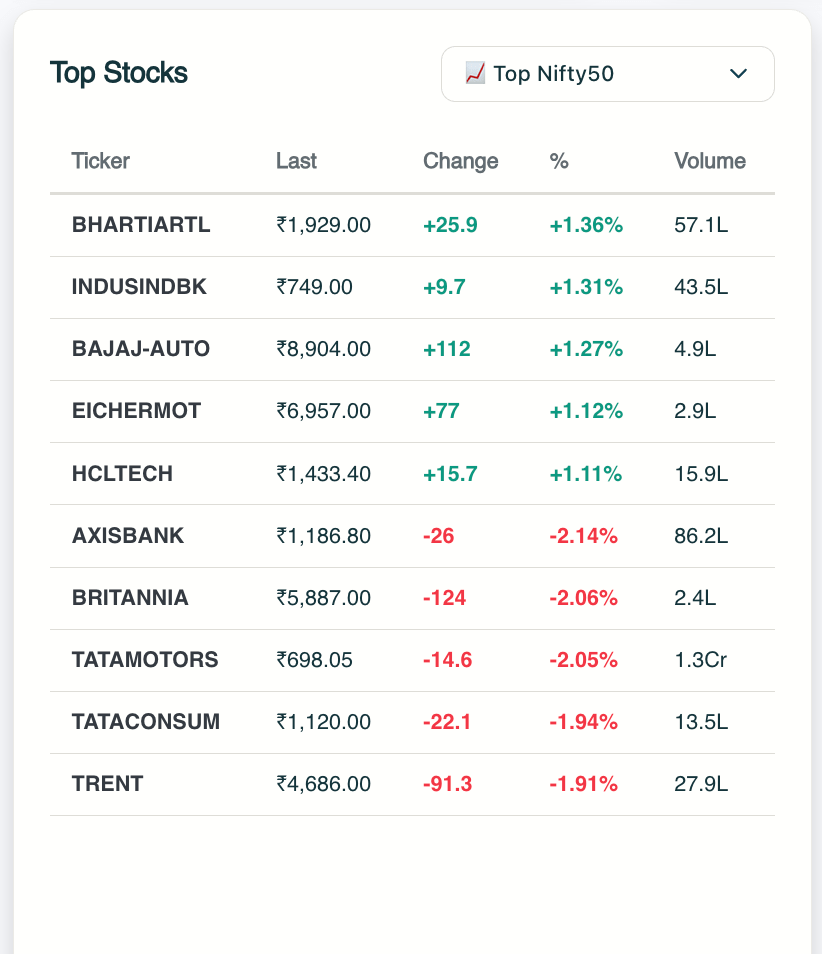
Today’s top gainer in NSE (National Stock Exchange) is ADANIENT.NS, while the top loser is HINDALCO.NS.
Today’s top gainer in BSE (Bombay Stock Exchange) is HINDUNILVR.BO, while the top loser is TCS.BO.
| Ticker | Last | Change | % | Volume |
|---|
Today’s top gainer in NSE (National Stock Exchange) is ADANIENT.NS, while the top loser is HINDALCO.NS.
Today’s top gainer in BSE (Bombay Stock Exchange) is HINDUNILVR.BO, while the top loser is TCS.BO.
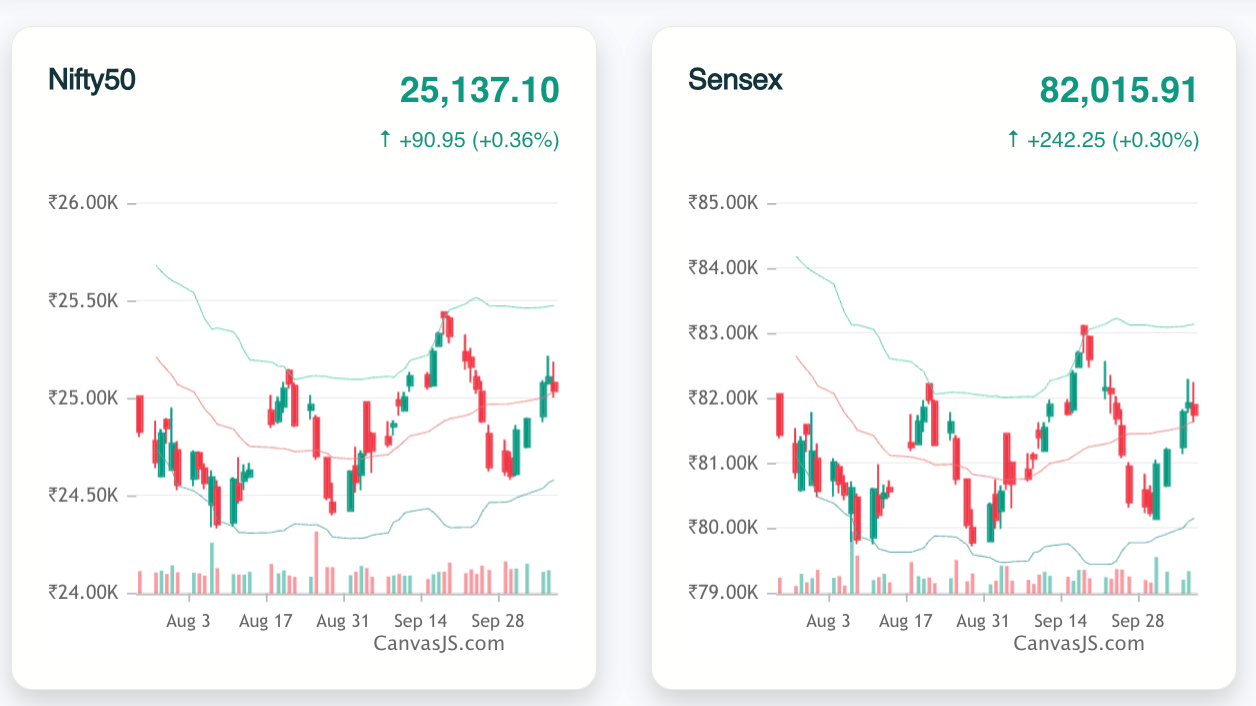
Nifty 50 and Sensex are indices for two main stock markets of India, which are NSE (National Stock Exchange) and BSE (Bombay Stock Exchange).
Nifty 50 is the index for NSE (National Stock Exchange), while Sensex is the index for BSE (Bombay Stock Exchange).
The candlestick chart (Nifty 50 chart and Sensex chart) indicates the daily movement of both the indices using candlestick charts and constantly displays the current value of Nifty 50 and Sensex with the change from the previously changed value.
A single candlestick displays the open, close, high, and low of the index for a single day, and if the candle is green, it indicates the market has closed at a higher value from its open value, and if it is red, then it has closed at a lower value from its open value.
We have utilized Bollinger Bands in the chart to help traders identify the volatility of the market and possible support and resistance lines, and one simple moving average running between both upper and lower bands represents a moving average of the close value of indices over a period of time.
For News-based stock analysis and to get the sentiment of the overall market, we are displaying the latest news along with machine learning-based sentiment analysis so that traders can easily identify negative and positive news from the market and make their investment decision.
Here we have news related to the overall market. To get news for a specific company, search the name of the company and get the latest news along with stock technical analysis and fundamental analysis.
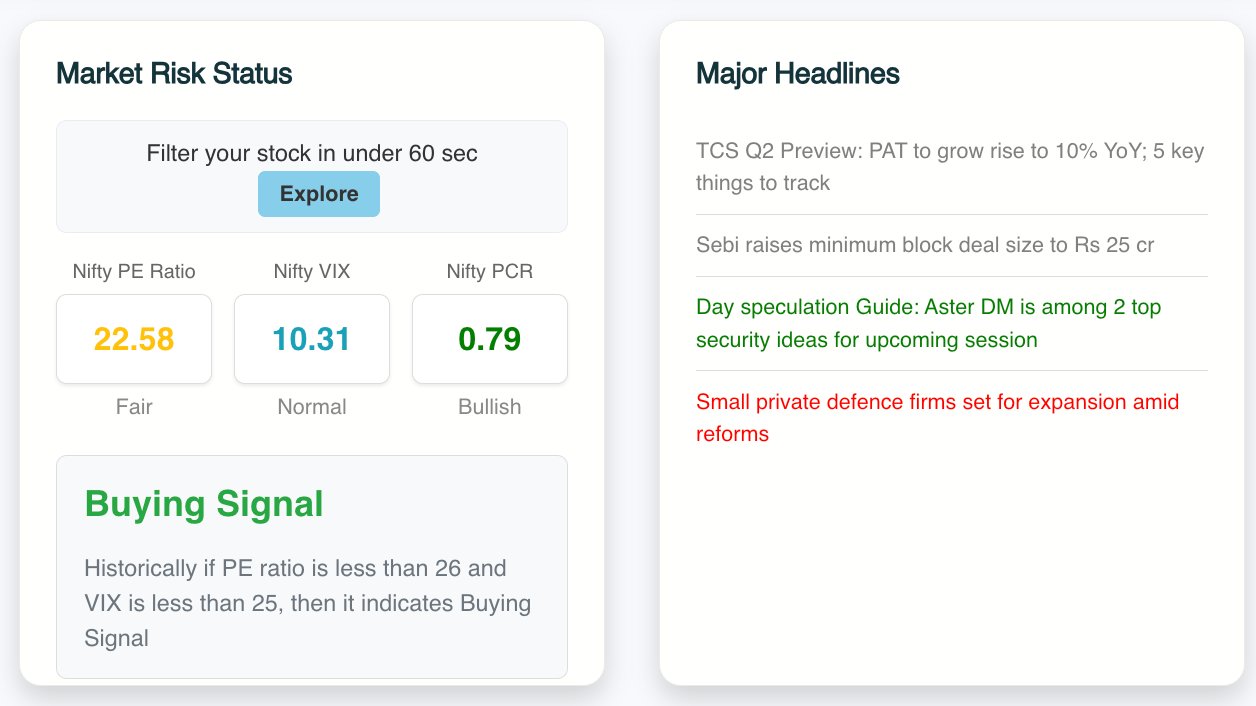
Also we have Nifty 50 technical analysis , Sensex technical analysis below are the link.
Nifty 50 SensexAs in India, we have two main stock markets, NSE (National Stock Exchange) and BSE (Bombay Stock Exchange), and the stocks are traded every day except Saturday, Sunday, and public holidays.
So, here in top gainers and top losers, we are displaying stocks with the highest gain for the day and stocks with the highest loss for the day, both in NSE (National Stock Exchange) and BSE (Bombay Stock Exchange), so that traders can determine outliers of the market for the particular day and make their further investment decision.
Also, you can find a list of holidays and major events in the stock market in the link below.
As in the Indian stock market, we have more than 5000 companies listed that belong to different stocks, and each has a different market cap. To easily understand what is happening in the market sector-wise, traders can utilize this heat map, where we have segregated the stocks according to which sector they belong, and in each sector we display stocks that have higher market cap, and the size of the tile in the sector is also determined by the market cap.
Also, to get more insight, the heat map changes the color as well according to the change from the previous day's change; if it is positive, then it is green, or if it is negative, then it is red.
Traders can click any tile or stock in the heat map and can analyze each stock separately, both technical and fundamental.